


1. February 2026 Gold Price Decline: A Comprehensive Analysis
Gold prices underwent a sharp correction in early February 2026, dropping more than 2.25% to approximately $4,839 per ounce by February 6, marking a 15% retreat from the record high of $5,608. This decline mirrored broader risk-aversion across global markets, with silver and Bitcoin facing similar pressures, including Bitcoin's steeper 45-50% drop from its peak. Profit-taking played a pivotal role, as evidenced by a 35% spike in gold futures trading volumes above the 30-day average and a 4.5-tonne outflow from SPDR Gold Shares (GLD), the world's largest gold ETF. The breach below the $5,150 support level triggered automated sell orders, accelerating the fall toward key zones like $5,050-$5,080, aligned with the 50-day moving average. Despite the tumble, analysts note the uptrend remains intact, with gold holding above its 50-day EMA, signaling potential for recovery amid ongoing volatility. This correction underscores gold's sensitivity to macroeconomic shifts, yet its safe-haven status persists, driven by inflation and central bank demand that propelled prices near $5,300 by late February. Investors witnessed a "perfect storm" of technical and fundamental factors, but long-term structural supports like declining real yields suggest the pullback is temporary.
2. Federal Reserve Leadership Transition and Policy Implications
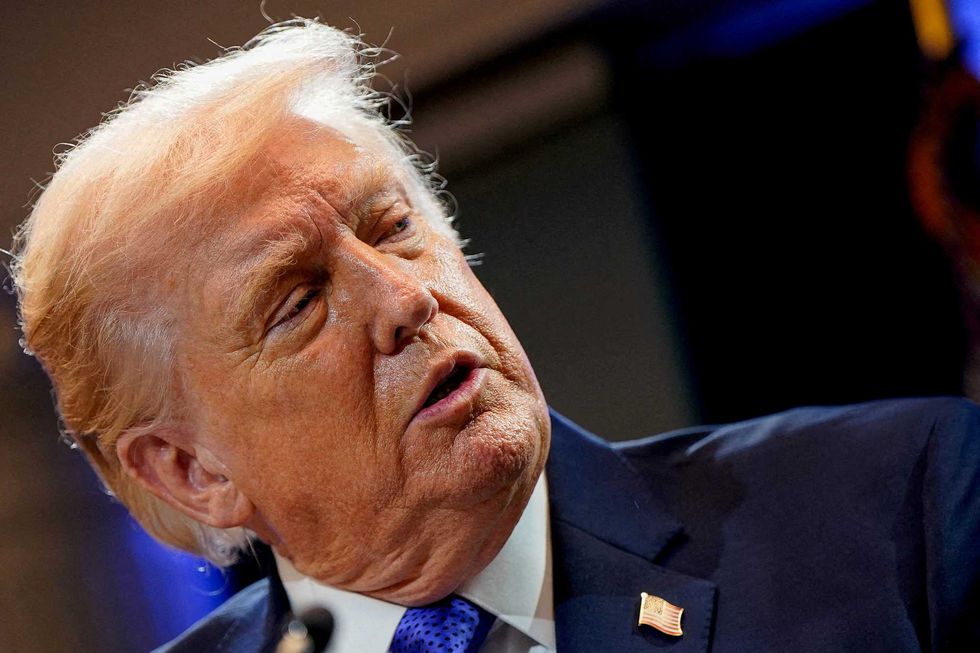
The nomination of Kevin Warsh as a candidate for Federal Reserve Chair signaled a hawkish pivot, raising expectations for sustained or elevated interest rates, which increases the opportunity cost of holding non-yielding assets like gold. Investors rotated into yield-bearing Treasury securities, contributing to the precious metal's decline as capital sought higher returns in a restrictive policy environment. Historical patterns show that tighter monetary stances inversely impact gold, with real yields' decline previously bolstering prices by lowering holding costs. Warsh's potential leadership could prolong this dynamic, as markets priced in fewer rate cuts, amplifying dollar strength and gold's headwinds. Central bank gold accumulation, ongoing for a third year, provides a counterbalance, with COMEX net long positions exceeding 300 tonnes by late February, reflecting strategic rather than speculative buying. This policy shift intersects with broader market recalibrations, where Fed expectations influenced the sharp single-day drop below $5,150. For cryptocurrency enthusiasts on MEXC, this highlights gold's role as a benchmark for digital assets, as tokenized gold products track physical spot prices amid policy-driven volatility. Overall, the transition embodies a macroeconomic recalibration favoring yield over inert stores of value in the near term.
3. US Dollar Index Gains Momentum
The US Dollar Index surged to a two-week high in February 2026, exerting downward pressure on gold through its traditional inverse correlation, making the metal costlier for non-dollar holders and curbing global demand. This dollar resurgence, combined with profit-taking, formed the core of the correction, as international buyers faced elevated pricing amid the index's climb. Previously, dollar weakness had fueled gold's rally by boosting foreign demand, but the reversal aligned with Fed hawkishness and risk-off sentiment. Market data from the period showed heightened sensitivity, with gold's drop coinciding with ETF outflows and futures volume spikes. Despite this, gold's uptrend held firm, never breaching weekly swing lows, per technical analysis forecasting Q2 highs. On MEXC, this dynamic impacts tokenized assets like PAX Gold (PAXG) and Tether Gold (XAUt), whose prices mirror spot gold, offering traders exposure without physical storage. The dollar's strength also pressured correlated assets like Bitcoin, which struggled to hold $70,000 amid heavy sell-side liquidity. Analysts emphasize monitoring dollar trends via MEXC's market tools, as sustained gains could test gold's $4,700 support, though central bank buying mitigates long-term downside.
4. Portfolio Liquidations Triggered by Market Volatility
Market volatility in equities and digital assets prompted institutional liquidations of gold positions to cover margin calls and offset losses in riskier holdings, exacerbating the February correction. The CME's hike in margin requirements for precious metals futures intensified forced selling, aligning with a 4.5-tonne GLD outflow and 35% volume surge. S&P 500's ongoing correction, deeper than prior waves yet with contained VIX spikes, amplified this cross-asset pressure. Bitcoin's orderbook showed elevated ask liquidity, echoing gold's profit-taking amid retests of key levels like $70,000. Institutional unwinding reflected portfolio rebalancing, not abandonment of gold's fundamentals, as COMEX longs remained robust. This liquidation wave broke technical supports like $5,150, targeting $5,050-$5,080 next. For MEXC users, it underscores correlations trackable via platform analysis tools, where gold's relative stability—15% drop versus Bitcoin's 45-50%—highlights its hedging value. Volatility also boosted tokenized bullion trading volumes on MEXC, outpacing traditional ETFs, signaling a shift to blockchain-based commodities. Recovery hinges on stabilizing equities, with gold's structural drivers like low real yields poised to resume support post-liquidation.
5. Implications for Digital Gold Products and Cryptocurrency Markets
The gold spot correction directly rippled into blockchain gold tokens like PAX Gold (PAXG) and Tether Gold (XAUt), available on MEXC, with prices declining in tandem but showcasing superior stability over Bitcoin's 45-50% plunge. PAXG and XAUt, backed 1:1 by physical gold, offer fractional ownership and 24/7 trading, their volumes surpassing ETFs amid the downturn. This event highlighted gold tokens' role in diversified crypto portfolios on MEXC, where users leverage market tools for correlation insights between commodities and digital assets. Bitcoin's vulnerability, with ask orders overwhelming bids near spot prices, contrasted gold's resilience, as net profit/loss data showed easing selling pressure. Tokenized products democratize access, appealing to retail amid volatility, with MEXC's liquidity enabling seamless hedging. Forecasts suggest gold's baseline elevation supports these assets long-term, despite short-term pain. As RWAs gain traction, MEXC-positioned tokens like PAXG bridge TradFi and crypto, with trading surges signaling institutional interest. Investors should eye MEXC's safe-haven strategies for navigating such linkages.
6. De-escalation of Geopolitical Tensions
Diplomatic signals from US officials favoring Middle East negotiations eroded the speculative premium that drove gold above $5,500, contributing to the correction as immediate fears subsided. Past cycles show such premiums—adding 5-10%—fade post-stabilization, though structural drivers like central bank buys endure. This de-escalation aligned with dollar strength and profit-taking, prompting risk premium unwinding. Geopolitical catalysts, including US-Israel-Iran tensions, had fueled rallies, but talks shifted sentiment, enabling liquidations. Yet, ETF inflows and COMEX longs persisted, indicating strategic allocation over speculation. On MEXC, this impacts gold tokens, reinforcing their stability versus volatile crypto amid reduced haven demand. Bitcoin faced independent pressures from orderbook imbalances. Analysts warn of interim volatility, but gold's uptrend—intact per EMA holds—eyes Q2 highs. MEXC tools aid monitoring these shifts.
7. Technical Outlook and Price Projections
The $4,700 level emerges as pivotal support, with failure risking $4,950, per technical breakdowns post-$5,150 breach. J.P. Morgan eyes $5,055 average for H2 2026, while broader forecasts span $2,800-$3,200 moderately, up to $6,000-$7,200 aggressively, or $8,000+ in blow-off scenarios. Uptrends persist, targeting Q2 peaks potentially above $8,000 if tensions reignite. MEXC traders can use platform analytics for these levels and correlations.
8. Related Resources
Explore MEXC's safe-haven strategies, tokenized commodities like PAXG/XAUt, USD Index trends, and market analysis tools for asset correlations. These resources empower informed trading amid volatility.
Description:Crypto Pulse is powered by AI and public sources to bring you the hottest token trends instantly. For expert insights and in-depth analysis, visit MEXC Learn.
The articles shared on this page are sourced from public platforms and are provided for informational purposes only. They do not necessarily represent the views of MEXC. All rights remain with the original authors. If you believe any content infringes upon third-party rights, please contact service@support.mexc.com for prompt removal.
MEXC does not guarantee the accuracy, completeness, or timeliness of any content and is not responsible for any actions taken based on the information provided. The content does not constitute financial, legal, or other professional advice, nor should it be interpreted as a recommendation or endorsement by MEXC.
Learn More About Humanity
View More
Polymarket vs. MEXC Prediction Market: Why Trade on a CEX?

How to Read Odds and Implied Probabilities in Prediction Markets
Spot Trading vs. Futures Trading: A Beginner's Guide to Determining Which is Right for You
Latest Updates on Humanity
View More
Crucial $9.68M H Token Unlock Leads Major $44M Crypto Release Wave This Week
Important news from last night and this morning (March 22-March 23)
'Mass disaster' described as insiders spill on chaos at vital government agency
HOT
Currently trending cryptocurrencies that are gaining significant market attention
Crypto Prices
The cryptocurrencies with the highest trading volume
Newly Added
Recently listed cryptocurrencies that are available for trading