Institutional investors aren't just betting on blockchain technology anymore. They're betting on user metrics that don't exist.Institutional investors aren't just betting on blockchain technology anymore. They're betting on user metrics that don't exist.

The $7 billion illusion: Institutional money is flooding into a market built on fake users | Opinion

2025/12/16 03:20

Disclosure: The views and opinions expressed here belong solely to the author and do not represent the views and opinions of crypto.news’ editorial.

Institutional investors poured around $50 billion into crypto ETFs this year. Fortune 500 blockchain adoption hit 60%. Major exchanges like Coinbase reported record revenue. The narrative is clear: crypto has finally achieved mainstream legitimacy.

Summary
  • Web3 growth is inflated: Up to 70% of reported users and marketing spend are bots or Sybil wallets, not real humans.
  • The economics are broken: True user acquisition costs are 2–5× higher than reported, and most airdrops reward fake or extractive actors.
  • Verification is now essential: Web3’s next winners will be projects that prove real human usage, not those optimizing vanity metrics.

But there’s a number missing from that story: one that should terrify everyone betting on web3’s growth. Only 30% of web3 marketing budgets actually reach real humans. The remaining 70% evaporates into bot farms, Sybil networks, and automated arbitrage schemes. 

And here’s what makes it worse: 65% of users who sign up never become real users at all. They’re wallet downloads, automated transactions, and fake engagement — the digital equivalent of paying for a concert where 70% of the audience is cardboard cutouts.

Institutional investors aren’t just betting on blockchain technology anymore. They’re betting on user metrics that don’t exist.

The crisis nobody wants to discuss

When Web3Quest analyzed verification data across major crypto projects in 2025, we discovered something that contradicts every bullish narrative in the industry.

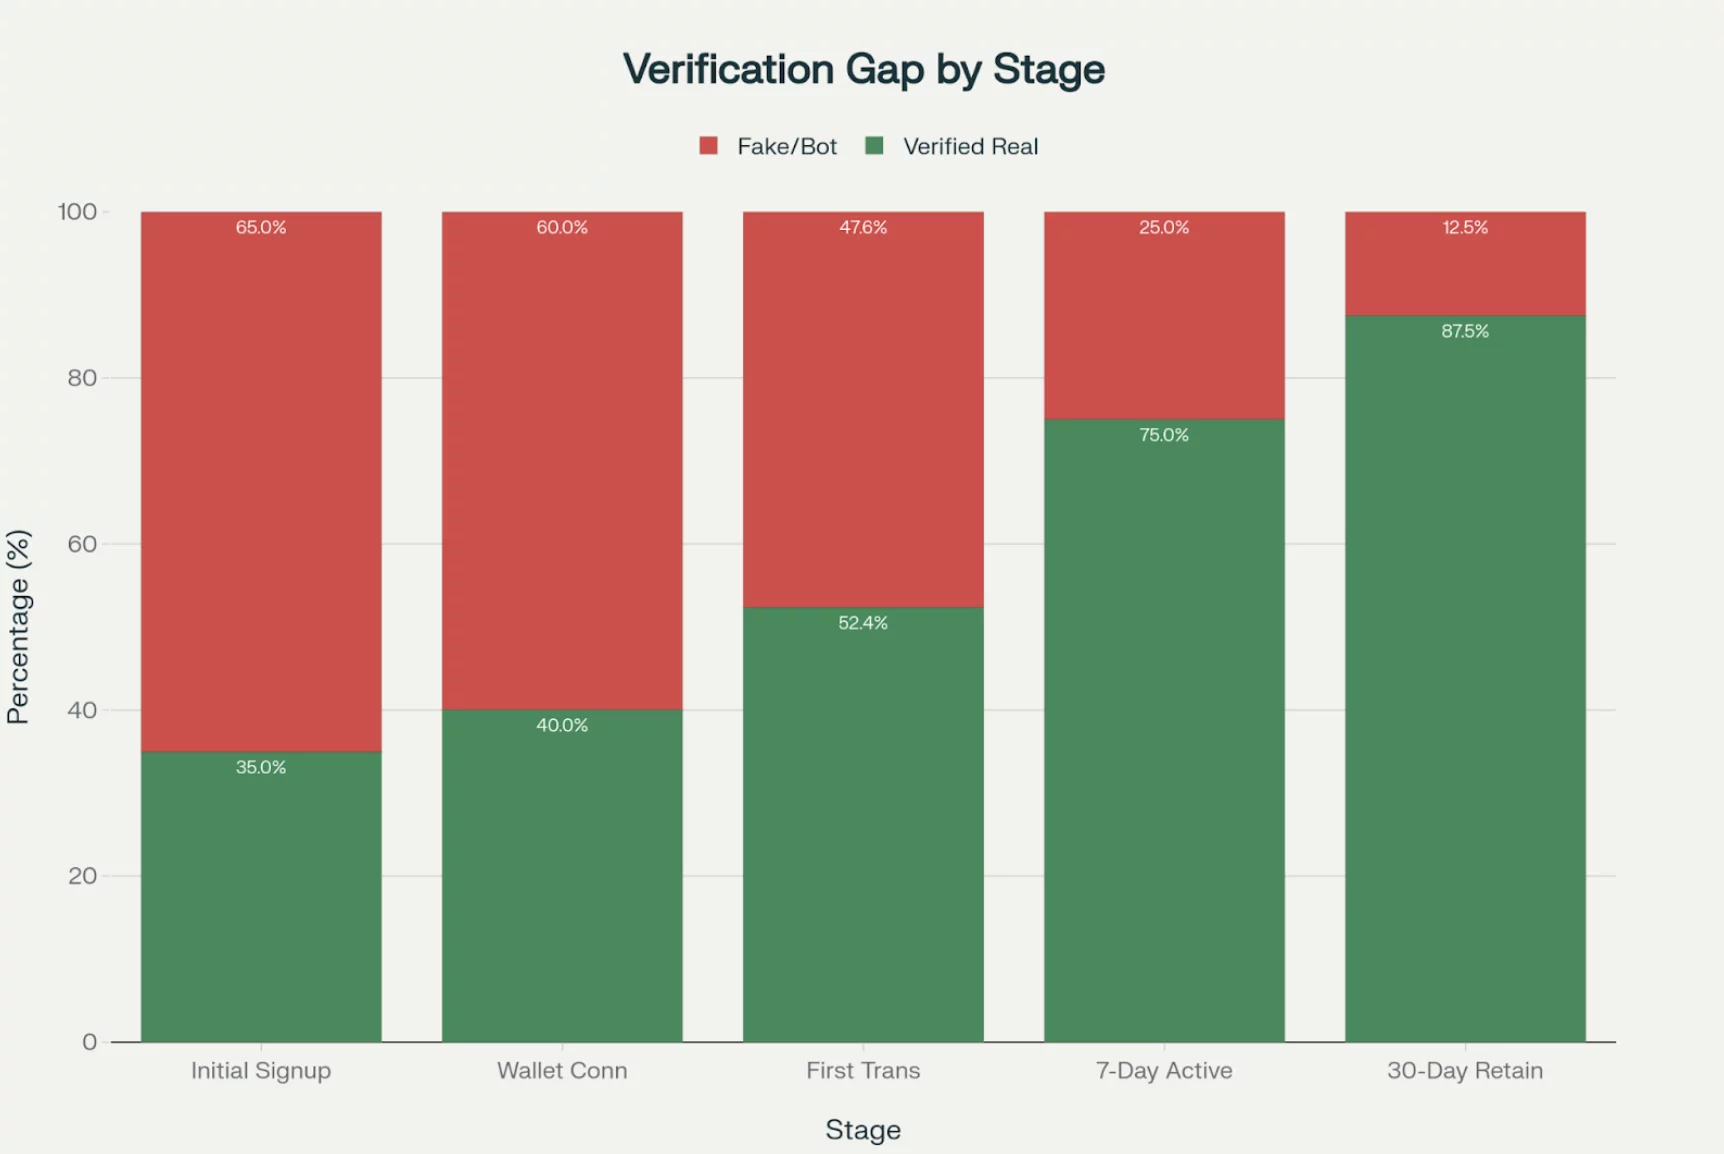
The verification gap is catastrophic:

User acquisition stageTotal users recordedVerified real usersFake/bot users
Initial signup100%35%65%
Wallet connected70%28%58%
First transaction42%22%48%
7-day active20%15%25%
30-day retained8%7%12.5%

What this means: A project that reports one million users has actually acquired roughly 350,000 genuine humans. The other 650,000 are bots, duplicate wallets, and automated engagement systems.

But project founders aren’t lying in their decks to investors. They genuinely believe their metrics, because nobody’s measuring real users. Everyone’s measuring reported users.

This isn’t fraud. It’s a systematic delusion at scale.

Chart shows: Initial Signup (100% total / 35% verified / 65% fake), Wallet Connected (70% total / 28% verified / 42% fake), First Transaction (42% total / 22% verified / 20% fake), 7-Day Active (20% total / 15% verified / 5% fake), 30-Day Retained (8% total / 7% verified / 1% fake)

The real cost of fake adoption

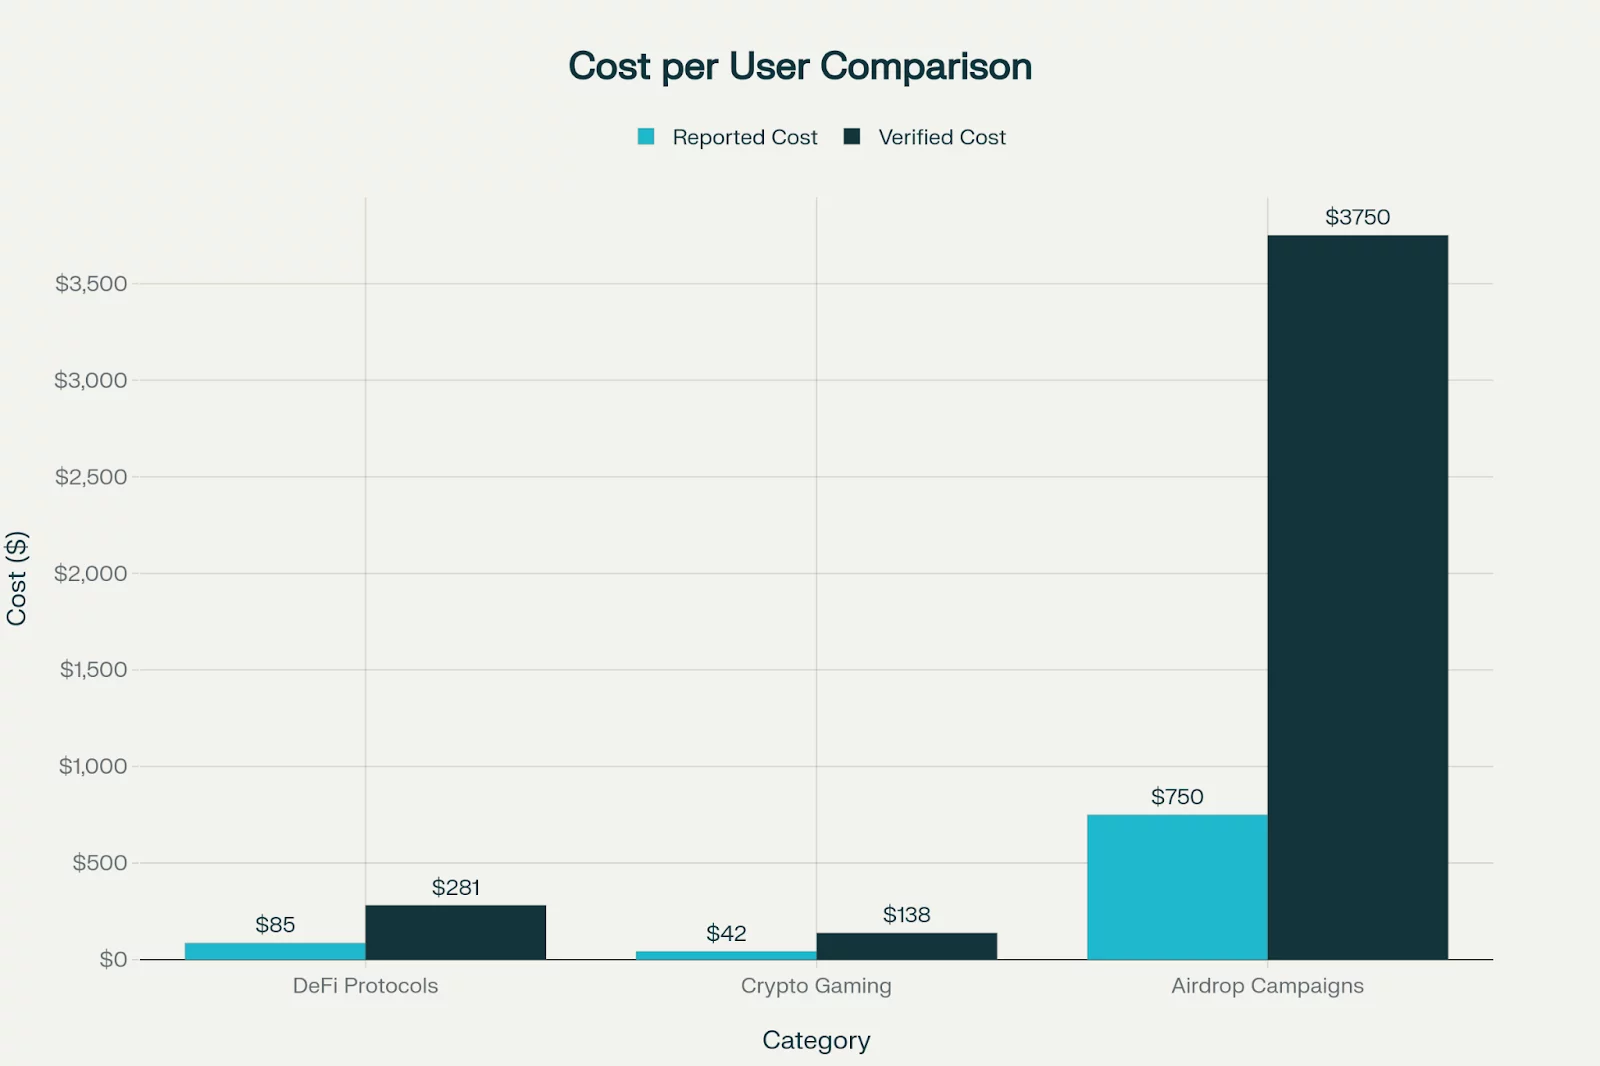
Here’s where it gets expensive for institutional capital. When you adjust user acquisition cost (CAC) to account for verification, the economics of web3 become almost unrecognizable:

CategoryReported cost per userVerified user cost (post-filtering)True CAC multiplier
DeFi protocols~$85 per user~$281 per verified user+230%
Crypto gaming~$42 per player~$138 per verified player+228%
Airdrop campaigns$500–$1,000 per user$2,500–$5,000+ per human+400–500%

Projects aren’t overspending on acquisition. They’re undercounting their true spend by including non-human metrics in the denominator.

When Coinbase reports a user milestone, it’s counting wallet installs. When a VC fund evaluates a protocol’s growth, they’re seeing total signups. Nobody’s asking: How many of these are real?

Chart shows: DeFi ($85 reported vs $281 verified, +230%), Gaming ($42 vs $138, +228%), Airdrops ($750 vs $3,750, +400%)

Where tokens actually go

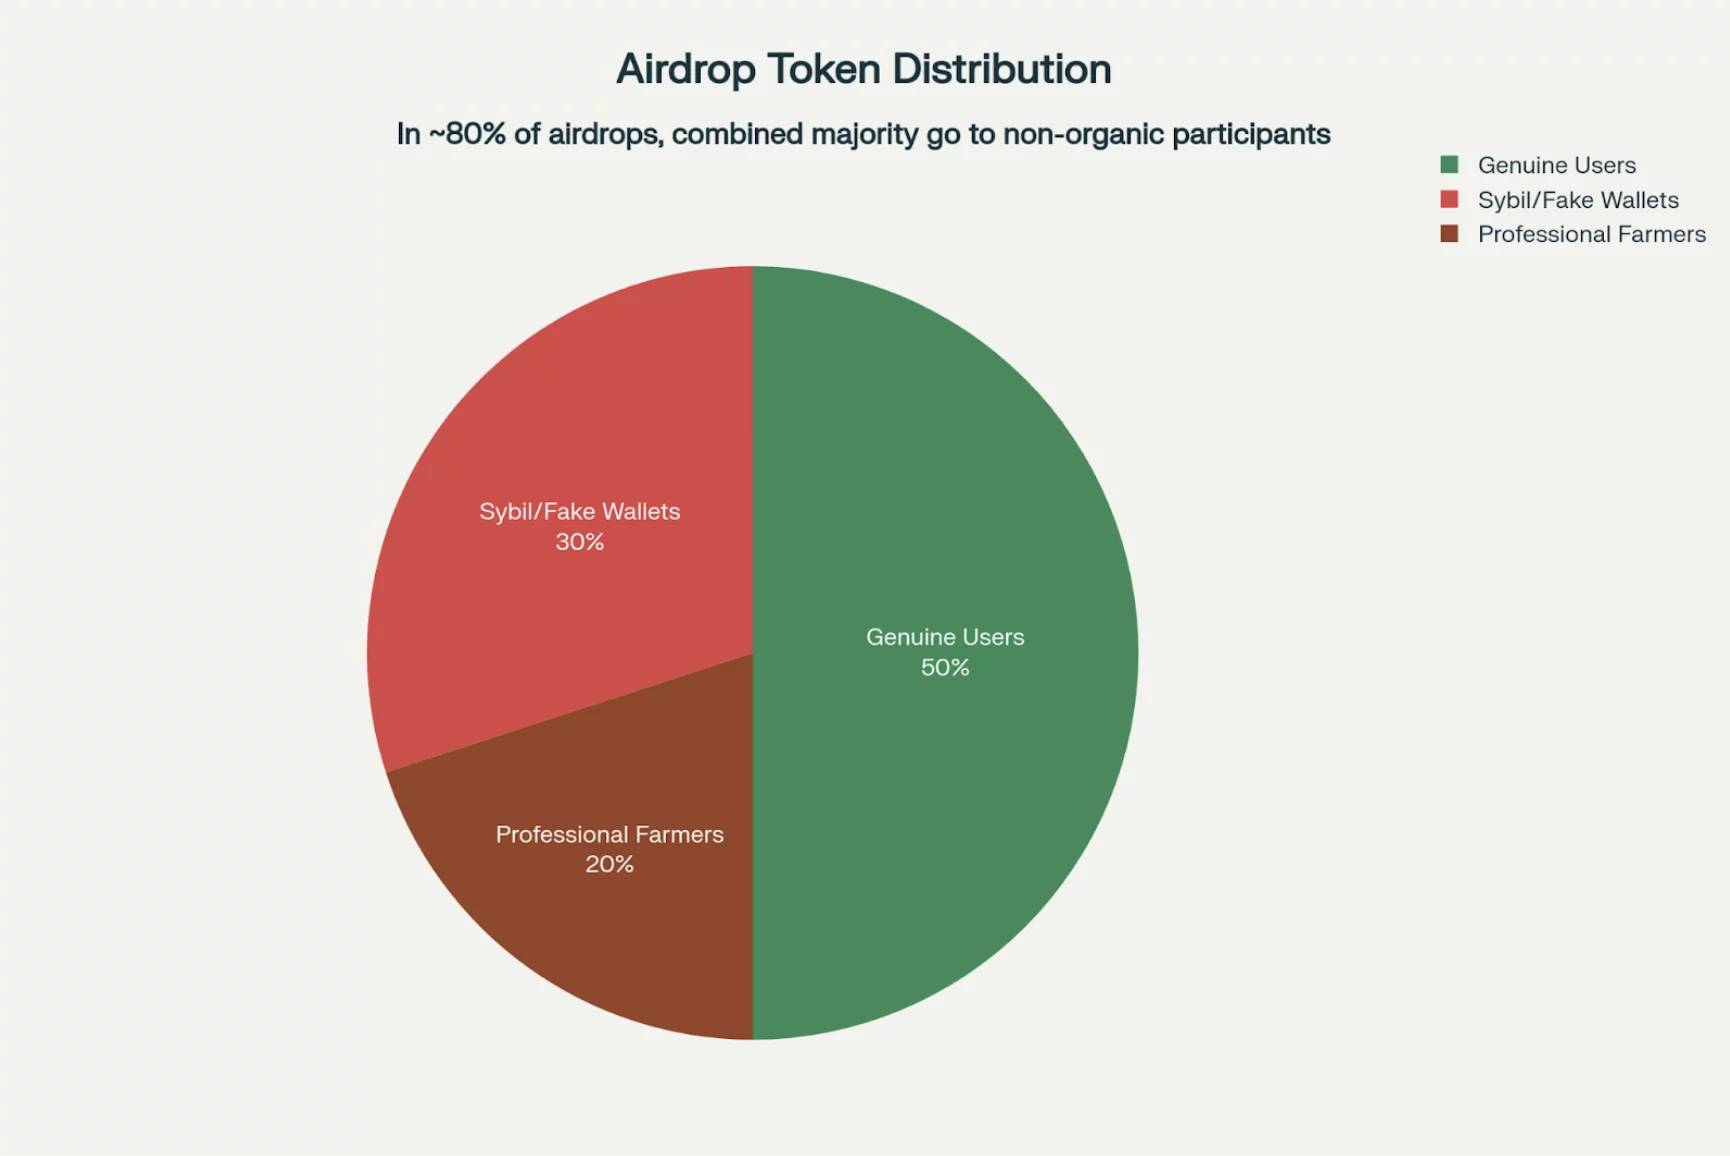
The airdrop market has become a particularly grotesque window into this problem. Our monitoring of major 2025 airdrops reveals:

Recipient category% of tokens distributedReality
Genuine users~50%Intended community recipients; real economic value
Sybil/fake wallets~30%Bot networks with zero engagement intent
Professional farmers~20%Sophisticated hunters who dump immediately

In approximately 80% of airdrops, the combined majority of tokens go to non-organic participants. Projects aren’t building communities. They’re subsidizing bot infrastructure and funding arbitrage networks — and paying for the privilege.

Meanwhile, institutional capital sees “user acquisition” and thinks “community building.” They see “token distribution” and assume “ecosystem alignment.” 

They see metrics. They don’t see reality.

Chart shows: Genuine users (50%), Sybil/fake wallets (30%), professional farmers (20%)

Why institutions should be terrified

Here’s the thing that should wake up every Fortune 500 CFO writing blockchain checks: Projects without real-time verification waste 65–70% of acquisition budgets on bot activity and Sybil farms. Yet only 5–10% of onboarded users become repeat dApp users within 30 days.

This means:

  • The headline growth metric is a mirage.
  • The actual engaged user base is 1/7th of the reported size.
  • The true cost of acquiring a real user is 2–5x higher than stated.
  • Retention crisis suggests most onboarded users were never human to begin with.

When a GameFi project reports two million downloads but fewer than 50,000 are daily active users after 30 days (a 97.5% drop-off), that’s not a product problem. That’s a metric problem.

And institutional capital cannot make confident decisions on compromised metrics.

The verification imperative: A moment of truth

The web3 industry stands at a crossroads — and 2026 will determine which path it takes.

Option A: Continue the theater. Project teams keep reporting metrics that assume every wallet is human. VCs keep using those metrics to benchmark performance. Institutions keep allocating capital based on numbers that don’t reflect reality. The space continues to grow, but nobody — not even founders — actually knows what’s real.

Option B: Embrace verification. Projects implement real-time user verification infrastructure. Airdrops are distributed to verified humans. Retention metrics start meaning something. Institutional investors finally have reliable data. The 2026 crypto cycle rewards projects that solve verification, not just growth hacking.

The projects winning in 2025 aren’t those spending the most on user acquisition. They’re the ones distinguishing real humans from artificial engagement before the marketing budget bleeds out.

Hyperliquid didn’t airdrop tokens. It built an infrastructure so strong that real users migrated there naturally. And it has lower bot-to-human ratios than projects that spent 10x more on acquisition.

That’s not luck. That’s the difference between measuring engagement and faking engagement.

The institutional question

Here’s what every Fortune 500 executive and institutional investor should be asking right now: If I cannot verify that 70% of a crypto project’s reported users are actually human, why am I confident in my capital allocation? The answer is: You shouldn’t be.

The web3 space has achieved mass adoption of reporting metrics without achieving mass adoption of verifying them. And institutional capital is flowing into this gap at $50 billion per year. That gap needs to close — not because crypto is good or bad, but because confidence in infrastructure requires auditability. You wouldn’t invest in a bank that couldn’t prove its deposits were real. You shouldn’t invest in a blockchain ecosystem that can’t prove its users are real.

The next phase of web3 adoption won’t be led by projects spending the most on marketing. It will be led by projects that solve this: How do you acquire verified users at scale? How do you measure their real engagement? How do you prove it onchain?

And the ones winning in 2026 will be those bold enough to start by admitting their current metrics aren’t.

Market Opportunity
Threshold Logo
Threshold Price(T)
$0.0094
$0.0094$0.0094
-3.19%
USD
Threshold (T) Live Price Chart
Disclaimer: The articles reposted on this site are sourced from public platforms and are provided for informational purposes only. They do not necessarily reflect the views of MEXC. All rights remain with the original authors. If you believe any content infringes on third-party rights, please contact service@support.mexc.com for removal. MEXC makes no guarantees regarding the accuracy, completeness, or timeliness of the content and is not responsible for any actions taken based on the information provided. The content does not constitute financial, legal, or other professional advice, nor should it be considered a recommendation or endorsement by MEXC.

You May Also Like

XRP price weakens at critical level, raising risk of deeper pullback

XRP price weakens at critical level, raising risk of deeper pullback

Markets Share Share this article
Copy linkX (Twitter)LinkedInFacebookEmail
XRP price weakens at critical level, raising
Share
Coindesk2025/12/16 11:34
Wormhole Unveils W Token 2.0 with Enhanced Tokenomics

Wormhole Unveils W Token 2.0 with Enhanced Tokenomics

The post Wormhole Unveils W Token 2.0 with Enhanced Tokenomics appeared on BitcoinEthereumNews.com. Joerg Hiller Sep 17, 2025 13:57 Wormhole introduces W Token 2.0, featuring upgraded tokenomics, a strategic Wormhole Reserve, and a 4% base yield, aiming to optimize ecosystem growth and align incentives. Wormhole has announced a significant upgrade to its native token, unveiling the W Token 2.0. This upgrade introduces new tokenomics including the establishment of a Wormhole Reserve, a 4% base yield, and an optimized unlock schedule, marking a pivotal development in the ecosystem, according to Wormhole. The W Token Evolution Launched in October 2020, Wormhole’s W token has been central to the platform’s mission of creating a connected internet economy. The latest upgrade aims to enhance the token’s utility across more than 40 blockchains. With a capped supply of 10 billion, the W token supports governance, staking, and ecosystem growth, aligning incentives for network security and development. Introducing the Wormhole Reserve The Wormhole Reserve will accumulate value from both onchain and offchain activities, supporting the ecosystem’s expansion. As Wormhole adoption grows, the token will capture value through network expansions and ecosystem applications, ensuring that growth is directly reflected in the token’s value. 4% Base Yield and Governance Rewards Wormhole 2.0 introduces a 4% base yield for W holders who actively participate in governance. The yield, derived from existing token supplies and protocol revenues, is designed to incentivize active participation without inflating the token supply. Optimized Unlock Schedule Updating its token release schedule, Wormhole replaces annual cliffs with bi-weekly unlocks, starting October 3, 2025. This change aims to reduce market pressure and provide a more stable environment for investors and contributors. The bi-weekly schedule will span over 4.5 years, affecting categories such as Guardian Nodes and Community & Launch. Wormhole’s Future Vision With these upgrades, Wormhole aims to expand its role as…
Share
BitcoinEthereumNews2025/09/18 15:48
Crucial US Stock Market Update: What Wednesday’s Mixed Close Reveals

Crucial US Stock Market Update: What Wednesday’s Mixed Close Reveals

BitcoinWorld Crucial US Stock Market Update: What Wednesday’s Mixed Close Reveals The financial world often keeps us on our toes, and Wednesday was no exception. Investors watched closely as the US stock market concluded the day with a mixed performance across its major indexes. This snapshot offers a crucial glimpse into current investor sentiment and economic undercurrents, prompting many to ask: what exactly happened? Understanding the Latest US Stock Market Movements On Wednesday, the closing bell brought a varied picture for the US stock market. While some indexes celebrated gains, others registered slight declines, creating a truly mixed bag for investors. The Dow Jones Industrial Average showed resilience, climbing by a notable 0.57%. This positive movement suggests strength in some of the larger, more established companies. Conversely, the S&P 500, a broader benchmark often seen as a barometer for the overall market, experienced a modest dip of 0.1%. The technology-heavy Nasdaq Composite also saw a slight retreat, sliding by 0.33%. This particular index often reflects investor sentiment towards growth stocks and the tech sector. These divergent outcomes highlight the complex dynamics currently at play within the American economy. It’s not simply a matter of “up” or “down” for the entire US stock market; rather, it’s a nuanced landscape where different sectors and company types are responding to unique pressures and opportunities. Why Did the US Stock Market See Mixed Results? When the US stock market delivers a mixed performance, it often points to a tug-of-war between various economic factors. Several elements could have contributed to Wednesday’s varied closings. For instance, positive corporate earnings reports from certain industries might have bolstered the Dow. At the same time, concerns over inflation, interest rate policies by the Federal Reserve, or even global economic uncertainties could have pressured growth stocks, affecting the S&P 500 and Nasdaq. Key considerations often include: Economic Data: Recent reports on employment, manufacturing, or consumer spending can sway market sentiment. Corporate Announcements: Strong or weak earnings forecasts from influential companies can significantly impact their respective sectors. Interest Rate Expectations: The prospect of higher or lower interest rates directly influences borrowing costs for businesses and consumer spending, affecting future profitability. Geopolitical Events: Global tensions or trade policies can introduce uncertainty, causing investors to become more cautious. Understanding these underlying drivers is crucial for anyone trying to make sense of daily market fluctuations in the US stock market. Navigating Volatility in the US Stock Market A mixed close, while not a dramatic downturn, serves as a reminder that market volatility is a constant companion for investors. For those involved in the US stock market, particularly individuals managing their portfolios, these days underscore the importance of a well-thought-out strategy. It’s important not to react impulsively to daily movements. Instead, consider these actionable insights: Diversification: Spreading investments across different sectors and asset classes can help mitigate risk when one area underperforms. Long-Term Perspective: Focusing on long-term financial goals rather than short-term gains can help weather daily market swings. Stay Informed: Keeping abreast of economic news and company fundamentals provides context for market behavior. Consult Experts: Financial advisors can offer personalized guidance based on individual risk tolerance and objectives. Even small movements in major indexes can signal shifts that require attention, guiding future investment decisions within the dynamic US stock market. What’s Next for the US Stock Market? Looking ahead, investors will be keenly watching for further economic indicators and corporate announcements to gauge the direction of the US stock market. Upcoming inflation data, statements from the Federal Reserve, and quarterly earnings reports will likely provide more clarity. The interplay of these factors will continue to shape investor confidence and, consequently, the performance of the Dow, S&P 500, and Nasdaq. Remaining informed and adaptive will be key to understanding the market’s trajectory. Conclusion: Wednesday’s mixed close in the US stock market highlights the intricate balance of forces influencing financial markets. While the Dow showed strength, the S&P 500 and Nasdaq experienced slight declines, reflecting a nuanced economic landscape. This reminds us that understanding the ‘why’ behind these movements is as important as the movements themselves. As always, a thoughtful, informed approach remains the best strategy for navigating the complexities of the market. Frequently Asked Questions (FAQs) Q1: What does a “mixed close” mean for the US stock market? A1: A mixed close indicates that while some major stock indexes advanced, others declined. It suggests that different sectors or types of companies within the US stock market are experiencing varying influences, rather than a uniform market movement. Q2: Which major indexes were affected on Wednesday? A2: On Wednesday, the Dow Jones Industrial Average gained 0.57%, while the S&P 500 edged down 0.1%, and the Nasdaq Composite slid 0.33%, illustrating the mixed performance across the US stock market. Q3: What factors contribute to a mixed stock market performance? A3: Mixed performances in the US stock market can be influenced by various factors, including specific corporate earnings, economic data releases, shifts in interest rate expectations, and broader geopolitical events that affect different market segments uniquely. Q4: How should investors react to mixed market signals? A4: Investors are generally advised to maintain a long-term perspective, diversify their portfolios, stay informed about economic news, and avoid impulsive decisions. Consulting a financial advisor can also provide personalized guidance for navigating the US stock market. Q5: What indicators should investors watch for future US stock market trends? A5: Key indicators to watch include upcoming inflation reports, statements from the Federal Reserve regarding monetary policy, and quarterly corporate earnings reports. These will offer insights into the future direction of the US stock market. Did you find this analysis of the US stock market helpful? Share this article with your network on social media to help others understand the nuances of current financial trends! To learn more about the latest stock market trends, explore our article on key developments shaping the US stock market‘s future performance. This post Crucial US Stock Market Update: What Wednesday’s Mixed Close Reveals first appeared on BitcoinWorld.
Share
Coinstats2025/09/18 05:30