

Dogecoin Price Prediction: DOGE Pre-Surge Signals Point to $0.20 Breakout
TLDR
- Long-term DOGE cycles suggest the current pre-surge phase may be nearing completion
- Inverse head and shoulders pattern signals short-term trend reversal potential
- TD Sequential buy setup points to downside exhaustion and rebound risk
- Break above key resistance could open upside toward $0.15–$0.20
Dogecoin (DOGE) price is drawing renewed attention as multiple technical indicators suggest a potential shift in trend. Long-term cycle analysis, combined with short-term reversal patterns, indicates DOGE may be transitioning from consolidation into an expansion phase. Based on current setups, analysts are watching for upside toward $0.14 in the near term, with higher targets near $0.20 if momentum sustains.
Dogecoin Price Near End of Long-Term Pre-Surge Phase
According to analyst Trader Tardigrade, the two-week Dogecoin chart highlights a repeating multi-cycle structure that has defined DOGE since 2014. Historical price action shows extended downtrends capped by descending trendlines, followed by prolonged consolidation phases. These periods, marked as “pre-surge phases,” have historically preceded strong upside breakouts.
SOURCE: X
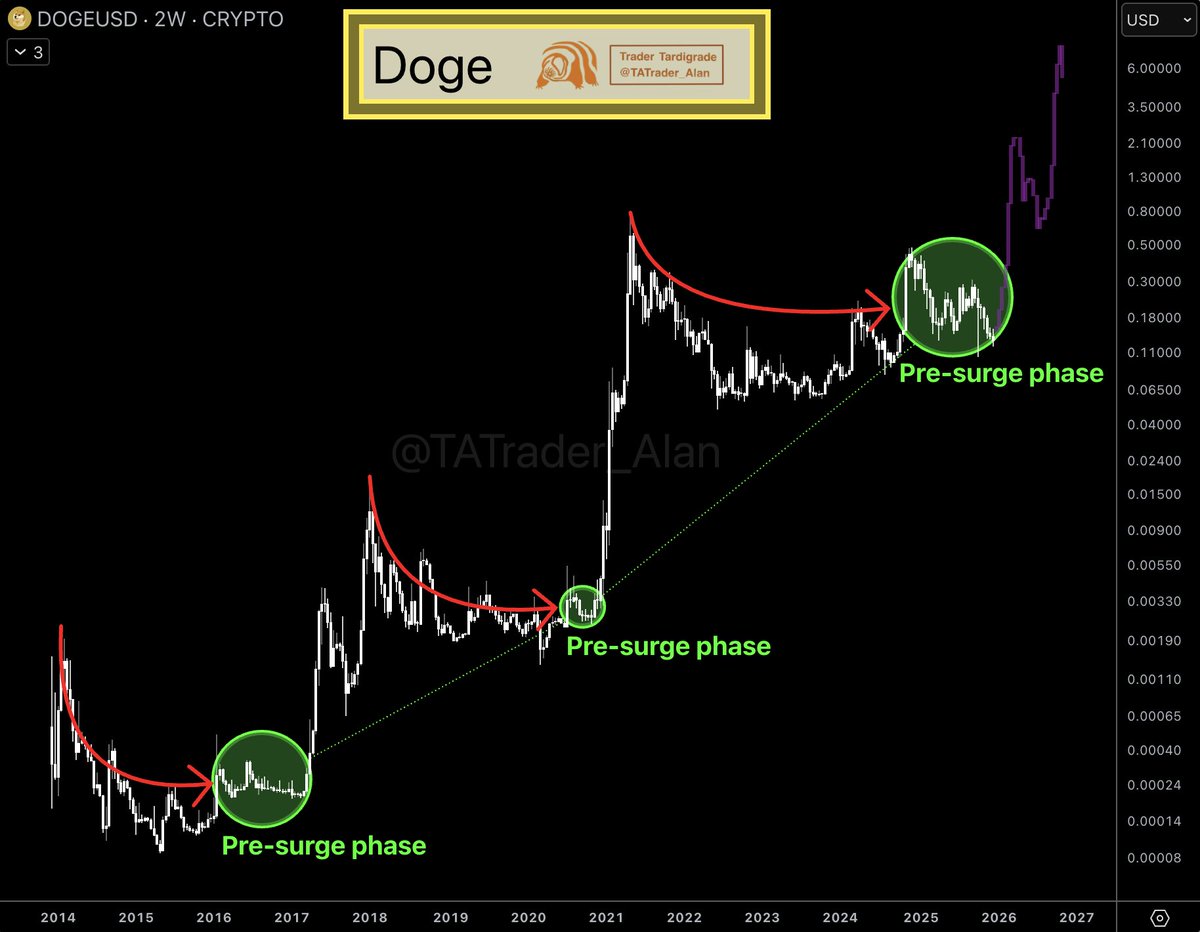
More so, the current cycle places Dogecoin price near the $0.09–$0.10 region, close to the descending multi-year resistance. Volume has steadily declined throughout the downtrend, a pattern commonly associated with seller exhaustion. This compression suggests that market participation has thinned, often a prerequisite for trend reversals in meme-driven assets.
Trader Tardigrade noted that a decisive break above the long-term trendline could trigger a fresh expansion phase. Based on previous cycles, initial upside targets are projected in the $0.20–$0.30 range. However, failure to hold above $0.08 could extend consolidation and delay the breakout scenario.
Inverse Pattern Signals Reversal Potential
Meanwhile, the two-hour Dogecoin chart presents a clearer short-term bullish structure. Trader Tardigrade identified a completed inverse Head and Shoulders pattern, a classic reversal setup following a decline. The formation shows a left shoulder near $0.1360, a head around $0.1280, and a right shoulder near $0.1320.
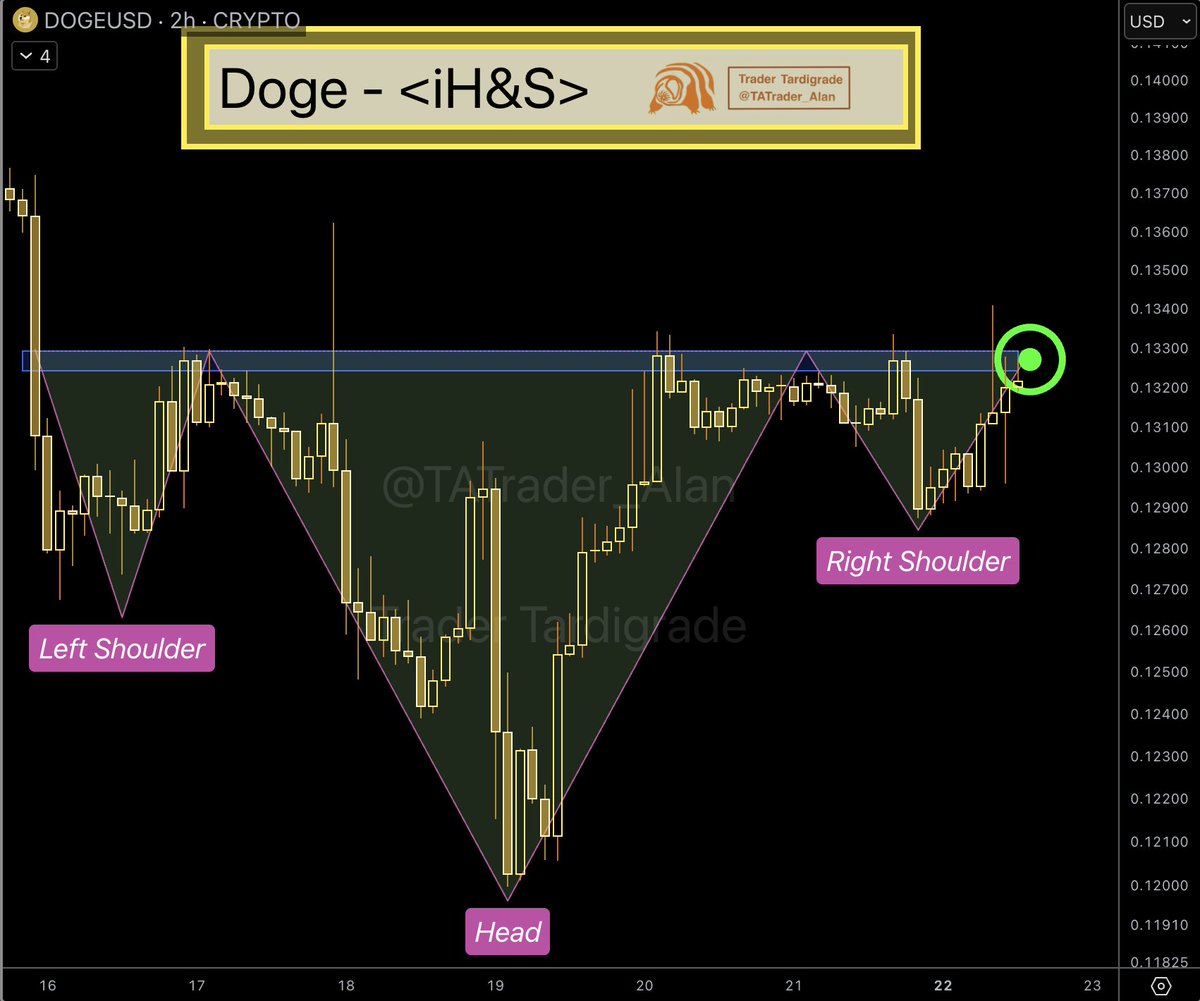
The neckline, positioned between $0.1330 and $0.1340, has already been breached, signaling a shift in control toward buyers. Volume increased during the right shoulder and breakout phase, reinforcing the pattern’s validity. Such confirmation often strengthens confidence in follow-through moves.
Based on the measured move of the pattern, short-term targets lie between $0.1400 and $0.1450. A sustained move could extend toward $0.1500 if market conditions remain supportive. Pullbacks toward the neckline may act as support, while a breakdown below the right shoulder would invalidate the setup.
TD Sequential Buy Signal Reinforces Upside Bias
In addition, analyst Ali highlighted a momentum-based signal on the three-day Dogecoin chart using the TD Sequential indicator. The indicator recently printed a “9” sell signal, followed by a “1” buy setup near the $0.132 level. This sequence often marks trend exhaustion and the start of a new directional move.
SOURCE: X
Following the signal, the price retraced toward the $0.121 support zone, aligning with oversold conditions. The indicator’s historical reliability on Dogecoin suggests such setups often precede notable rebounds. The defined range between $0.121 and $0.142 now acts as a critical decision zone.
Ali pointed to an initial reclaim of $0.138–$0.142 as confirmation of bullish continuation. A successful move above this range could open the path toward $0.150, aligning with targets from the inverse pattern. At the time of writing, Dogecoin price trades near $0.13, keeping reversal scenarios firmly in focus.
The post Dogecoin Price Prediction: DOGE Pre-Surge Signals Point to $0.20 Breakout appeared first on CoinCentral.
You May Also Like

Bitcoin Has Taken Gold’s Role In Today’s World, Eric Trump Says

UK Looks to US to Adopt More Crypto-Friendly Approach
