Highlights: The Ethereum price is currently up 1% to $2,964 as bulls eye higher levels. ETH derivatives data show mixed signals as the funding rate Highlights: The Ethereum price is currently up 1% to $2,964 as bulls eye higher levels. ETH derivatives data show mixed signals as the funding rate

Ethereum Price Prediction: ETH at a Decision Zone as Bulls Target $3,000

Highlights:

  • The Ethereum price is currently up 1% to $2,964 as bulls eye higher levels.
  • ETH derivatives data show mixed signals as the funding rate flips positive.
  • The technical outlook shows ETH at a decision zone, with the bulls eyeing $3,000 zone.

Ethereum price(ETH) is trading near $3,000 level, currently at $2,964, making a 1% surge in the past 24 hours. The derivatives data on Ethereum have a mixed signal. The Open Interest (OI) in the futures contracts of ETH decreased to $37.22 billion, marking a slight 0.27% plunge in the past 24 hours. This decline in OI indicates a lack of confidence in investors. However, the volume has soared to $45 billion, marking a whopping 39% rise. This signals that the trading activity in the ETH market is intense, with ETH at a decision zone. 

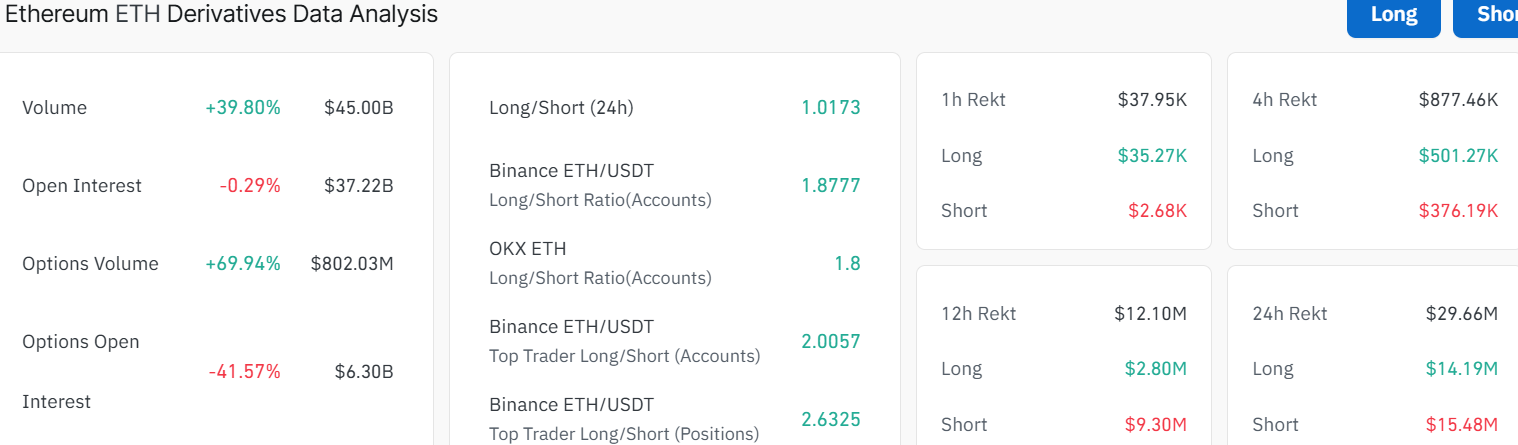
ETH Derivatives Data: CoinGlass

On the other hand, the ETH OI-Weighted Funding Rate has flipped positive, at 0.0026%. This suggests that the longs are paying the shorts, and it could lead to the Ethereum price surging above $3000 level soon. 

Ethereum OI-Weighted Funding Rate: CoinGlass

ETH At a Decision Zone

The Ethereum price daily chart action has shifted into a corrective phase after staging a strong rally from the mid-2024 support region near $2,100. That push skyrocketed the Ethereum price toward a cycle peak around $4,900, where buying momentum began to fade, and profit-taking emerged.

Following the rejection at the highs, Ethereum entered a prolonged pullback, forcing the altcoin into a rounding top pattern. This retracement has dragged the price below both the 50-day($3,072) and 200-day($3,583) Simple Moving Averages (SMAs), which now act as the immediate resistance levels.

Ethereum Price Prediction: ETH at a Decision Zone as Bulls Target $3,000ETH/USD 1-day chart: TradingView

Meanwhile, the Relative Strength Index (RSI) is hovering around 46.13, suggesting subdued momentum without reaching oversold conditions. This level reflects a tug-of-war among the bulls and bears, reinforcing the idea that Ethereum is consolidating and could move in either direction.  

Meanwhile, the MACD indicator is still below the neutral line(0.0000). However, downside momentum is weakening. The histogram bars are contracting, signalling that bearish pressure is losing strength, as the blue MACD line flips above the signal line.

Although no decisive bullish crossover has yet formed, the Ethereum network activity has nearly doubled in a week.  According to popular crypto analyst Ali Martinez, active ETH addresses have risen from 496,000 to 800,000. 

Looking at the bigger picture, the ETH price is at a make-or-break level. The confluence of the 50-day MA and horizontal support between $2,913–$3,072 forms a critical demand zone that bulls must defend.

A breakdown below this support region could expose ETH to a deeper move toward the major demand zone near $2,700. A break below this level will see further downside, revisiting the broader base around $2,500-$2,100. Meanwhile, Ali has noted that the 3-day chart shows $1700 as a great spot to buy ETH.

On the other hand, if buyers successfully defend the 50-day SMA and momentum stabilizes, the price of ETH could attempt a recovery toward $3,172-$3,200 zone. A sustained push above this region would place the 200-day SMA at $3,583 back into focus as the next resistance hurdle.

eToro Platform

Best Crypto Exchange

  • Over 90 top cryptos to trade
  • Regulated by top-tier entities
  • User-friendly trading app
  • 30+ million users
9.9
Visit eToro

eToro is a multi-asset investment platform. The value of your investments may go up or down. Your capital is at risk. Don’t invest unless you’re prepared to lose all the money you invest. This is a high-risk investment, and you should not expect to be protected if something goes wrong.

Market Opportunity
Ethereum Logo
Ethereum Price(ETH)
$2,935.03
$2,935.03$2,935.03
+0.42%
USD
Ethereum (ETH) Live Price Chart
Disclaimer: The articles reposted on this site are sourced from public platforms and are provided for informational purposes only. They do not necessarily reflect the views of MEXC. All rights remain with the original authors. If you believe any content infringes on third-party rights, please contact service@support.mexc.com for removal. MEXC makes no guarantees regarding the accuracy, completeness, or timeliness of the content and is not responsible for any actions taken based on the information provided. The content does not constitute financial, legal, or other professional advice, nor should it be considered a recommendation or endorsement by MEXC.

You May Also Like

Is Doge Losing Steam As Traders Choose Pepeto For The Best Crypto Investment?

Is Doge Losing Steam As Traders Choose Pepeto For The Best Crypto Investment?

The post Is Doge Losing Steam As Traders Choose Pepeto For The Best Crypto Investment? appeared on BitcoinEthereumNews.com. Crypto News 17 September 2025 | 17:39 Is dogecoin really fading? As traders hunt the best crypto to buy now and weigh 2025 picks, Dogecoin (DOGE) still owns the meme coin spotlight, yet upside looks capped, today’s Dogecoin price prediction says as much. Attention is shifting to projects that blend culture with real on-chain tools. Buyers searching “best crypto to buy now” want shipped products, audits, and transparent tokenomics. That frames the true matchup: dogecoin vs. Pepeto. Enter Pepeto (PEPETO), an Ethereum-based memecoin with working rails: PepetoSwap, a zero-fee DEX, plus Pepeto Bridge for smooth cross-chain moves. By fusing story with tools people can use now, and speaking directly to crypto presale 2025 demand, Pepeto puts utility, clarity, and distribution in front. In a market where legacy meme coin leaders risk drifting on sentiment, Pepeto’s execution gives it a real seat in the “best crypto to buy now” debate. First, a quick look at why dogecoin may be losing altitude. Dogecoin Price Prediction: Is Doge Really Fading? Remember when dogecoin made crypto feel simple? In 2013, DOGE turned a meme into money and a loose forum into a movement. A decade on, the nonstop momentum has cooled; the backdrop is different, and the market is far more selective. With DOGE circling ~$0.268, the tape reads bearish-to-neutral for the next few weeks: hold the $0.26 shelf on daily closes and expect choppy range-trading toward $0.29–$0.30 where rallies keep stalling; lose $0.26 decisively and momentum often bleeds into $0.245 with risk of a deeper probe toward $0.22–$0.21; reclaim $0.30 on a clean daily close and the downside bias is likely neutralized, opening room for a squeeze into the low-$0.30s. Source: CoinMarketcap / TradingView Beyond the dogecoin price prediction, DOGE still centers on payments and lacks native smart contracts; ZK-proof verification is proposed,…
Share
BitcoinEthereumNews2025/09/18 00:14
Liquidity Boost Stabilizes Solana-Based Stablecoin USX After Market Drop

Liquidity Boost Stabilizes Solana-Based Stablecoin USX After Market Drop

Solana's USX stablecoin experiences a significant market drop due to liquidity issues. Solstice Finance intervenes to stabilize the value.Read more...
Share
Coinstats2025/12/27 12:51
3 Paradoxes of Altcoin Season in September

3 Paradoxes of Altcoin Season in September

The post 3 Paradoxes of Altcoin Season in September appeared on BitcoinEthereumNews.com. Analyses and data indicate that the crypto market is experiencing its most active altcoin season since early 2025, with many altcoins outperforming Bitcoin. However, behind this excitement lies a paradox. Most retail investors remain uneasy as their portfolios show little to no profit. This article outlines the main reasons behind this situation. Altcoin Market Cap Rises but Dominance Shrinks Sponsored TradingView data shows that the TOTAL3 market cap (excluding BTC and ETH) reached a new high of over $1.1 trillion in September. Yet the share of OTHERS (excluding the top 10) has declined since 2022, now standing at just 8%. OTHERS Dominance And TOTAL3 Capitalization. Source: TradingView. In past cycles, such as 2017 and 2021, TOTAL3 and OTHERS.D rose together. That trend reflected capital flowing not only into large-cap altcoins but also into mid-cap and low-cap ones. The current divergence shows that capital is concentrated in stablecoins and a handful of top-10 altcoins such as SOL, XRP, BNB, DOG, HYPE, and LINK. Smaller altcoins receive far less liquidity, making it hard for their prices to return to levels where investors previously bought. This creates a situation where only a few win while most face losses. Retail investors also tend to diversify across many coins instead of adding size to top altcoins. That explains why many portfolios remain stagnant despite a broader market rally. Sponsored “Position sizing is everything. Many people hold 25–30 tokens at once. A 100x on a token that makes up only 1% of your portfolio won’t meaningfully change your life. It’s better to make a few high-conviction bets than to overdiversify,” analyst The DeFi Investor said. Altcoin Index Surges but Investor Sentiment Remains Cautious The Altcoin Season Index from Blockchain Center now stands at 80 points. This indicates that over 80% of the top 50 altcoins outperformed…
Share
BitcoinEthereumNews2025/09/18 01:43