An anonymous poster on 4chan, who correctly flagged Bitcoin’s cycle top on October 6, 2025, nearly two years in advance, has returned with a far more aggressiveAn anonymous poster on 4chan, who correctly flagged Bitcoin’s cycle top on October 6, 2025, nearly two years in advance, has returned with a far more aggressive

4chan Trader Who Nailed Bitcoin’s October All-Time High Calls $250,000 in 2026

An anonymous poster on 4chan, who correctly flagged Bitcoin’s cycle top on October 6, 2025, nearly two years in advance, has returned with a far more aggressive call. The trader predicts Bitcoin to reach $250,000 in 2026. 

The prediction has resurfaced across crypto circles precisely as many on-chain and technical indicators turn bearish.

A Proven Call, Not a Price Target

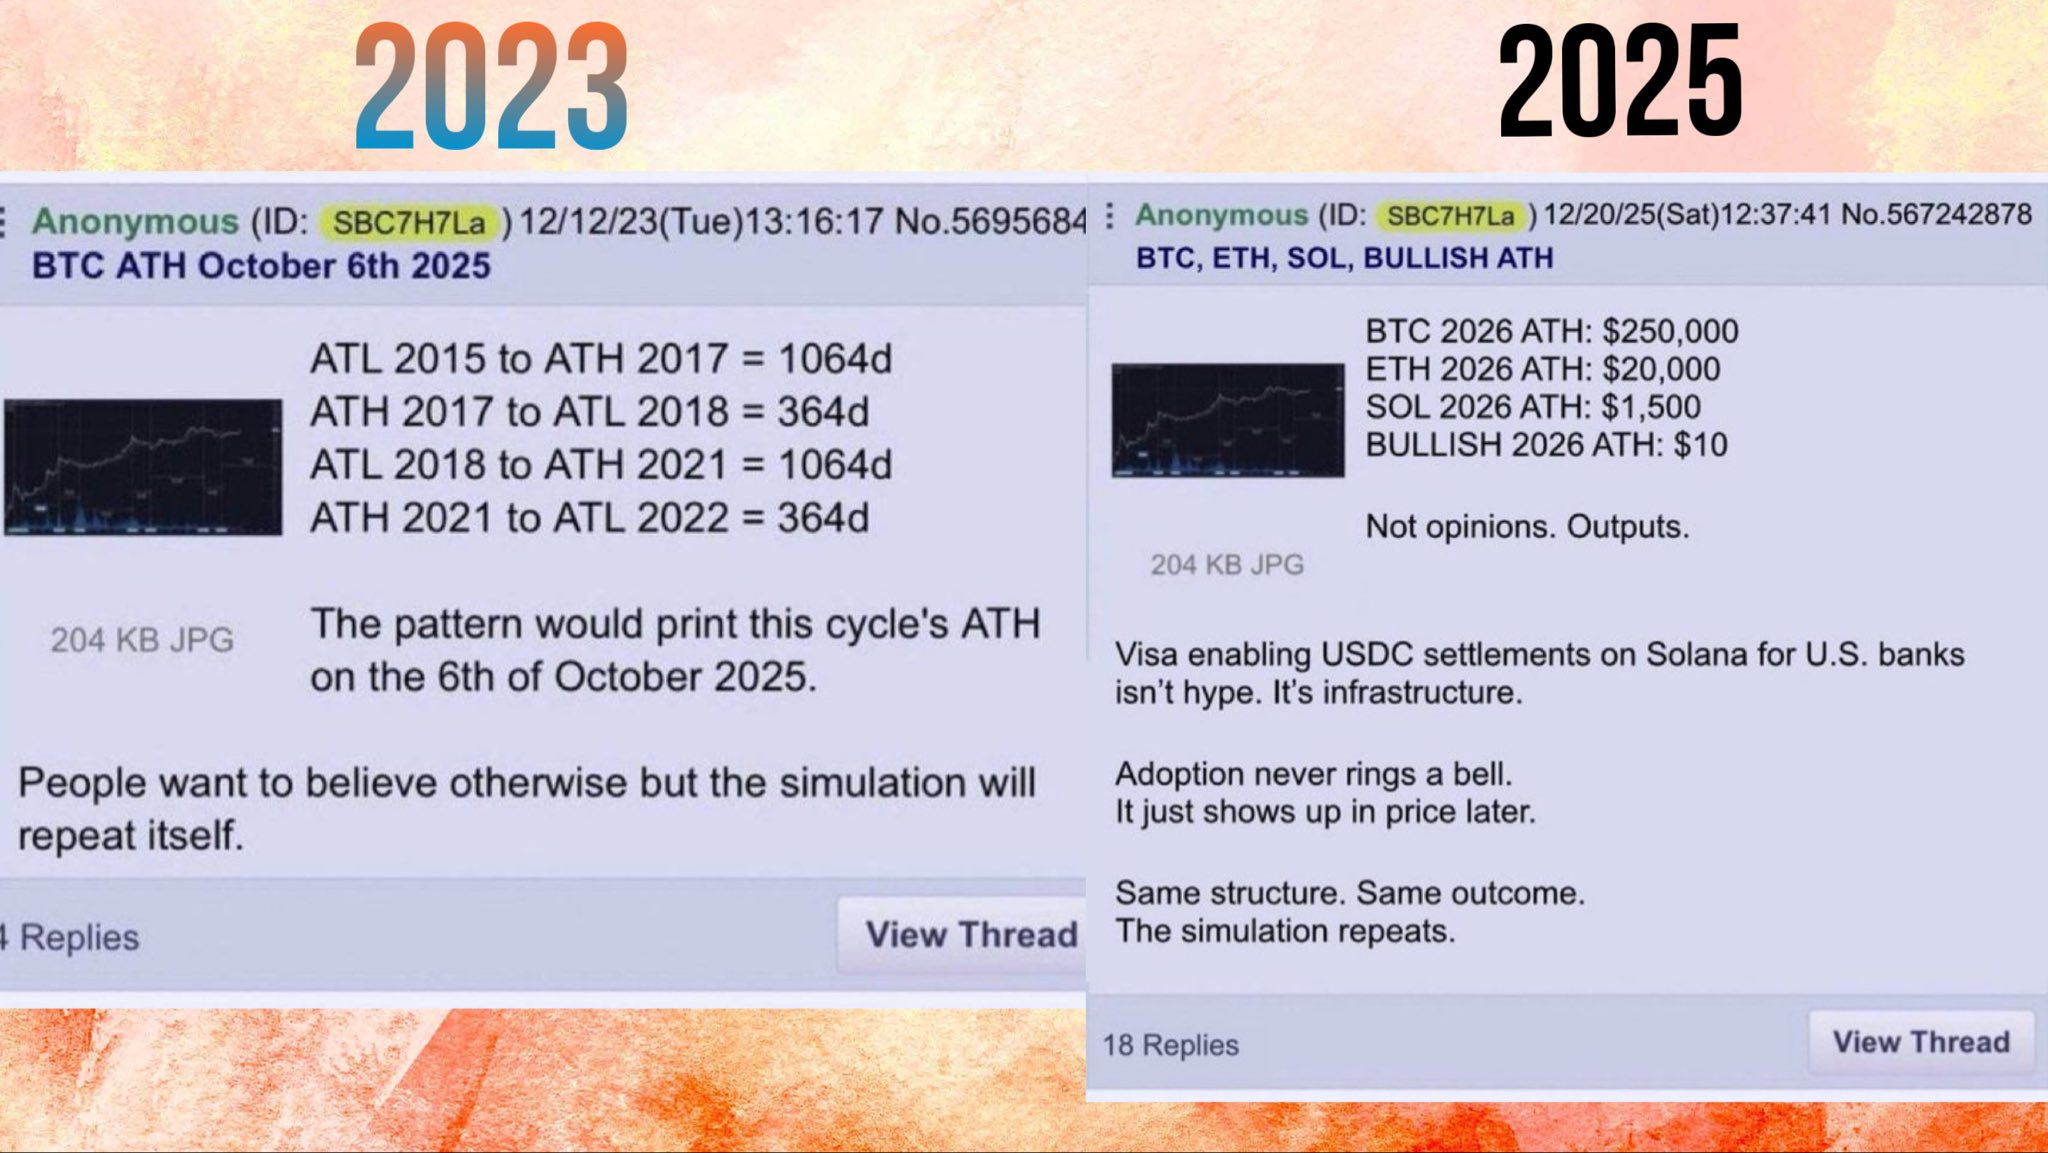
Back in December 2023, the anonymous poster outlined a time-based cycle model rather than a price forecast. The thesis relied on historical symmetry. Roughly 1,064 days from bear-market lows to cycle highs, followed by nearly 364 days of decline. 

That structure projected the next all-time high to land on October 6, 2025, almost exactly when Bitcoin topped near its peak before crashing 4 days later.

Anon 4chan Users Bitcoin Prediction

That accuracy has given the new forecast weight, even among skeptics.

In the latest post, the anon argues that the broader structure has not broken. 

Instead, the current drawdown represents a reset phase before another expansion leg, with 2026 penciled in as the next price climax.

Most Bitcoin Charts Look Bearish Right Now

Short-term data tells a very different story.

The Bitcoin Combined Market Index (BCMI) has rolled over from elevated levels, historically associated with late-cycle conditions. 

Momentum indicators have weakened, and price has struggled to reclaim key psychological zones after the October peak.

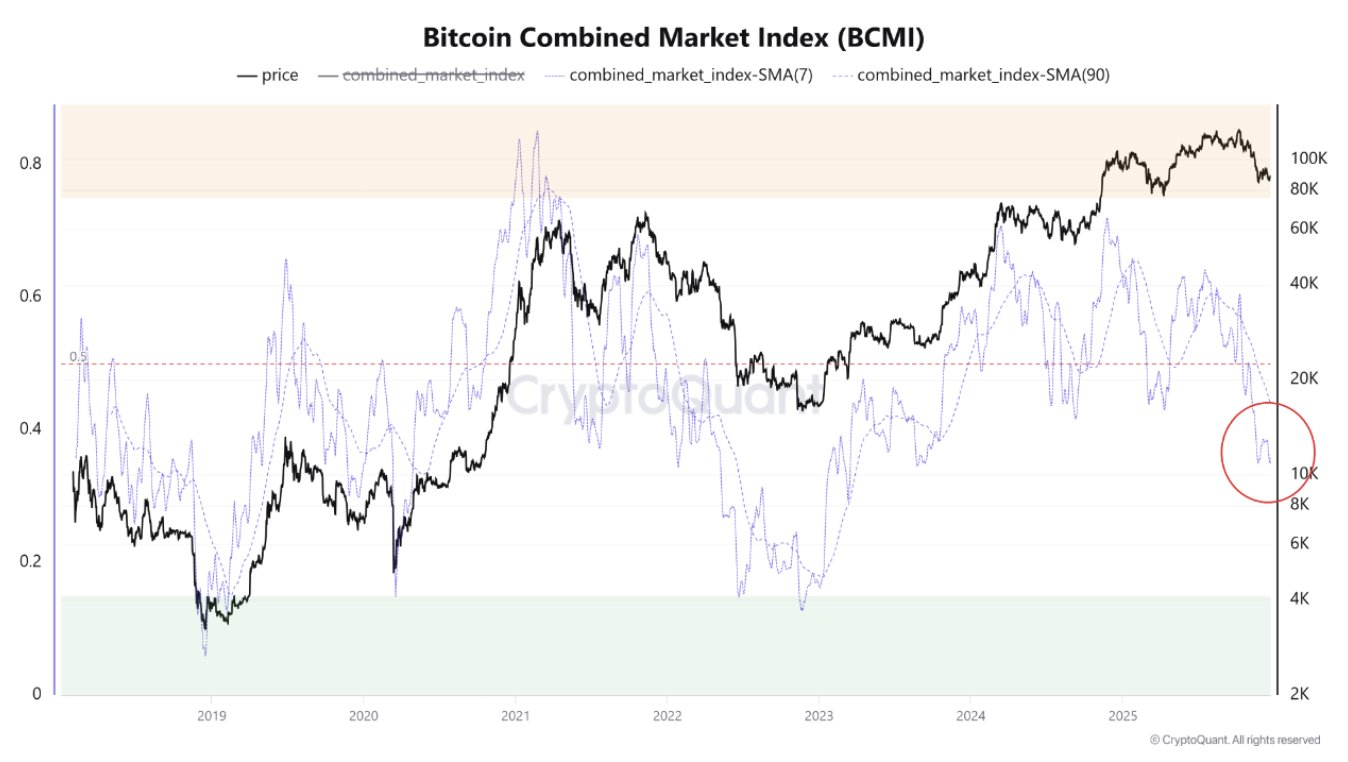
Bitcoin Combined Market Index. Source: CryptoQuant

Meanwhile, apparent demand growth, measured by net new buyer activity, has slowed sharply from early-2025 highs. Similar demand slowdowns preceded major corrections in past cycles, including 2021 and 2017.

From a traditional analytical lens, these signals point to caution.

Why the Bull Case Hasn’t Disappeared

The anonymous forecast challenges the idea that local bearish signals define the full cycle. Previous bull markets also saw multi-month corrections and demand resets before making their final parabolic moves.

Structural tailwinds remain intact. Bitcoin supply growth continues to compress post-halving. Institutional infrastructure, from ETFs to payment rails, remains embedded, even as speculative interest cools. 

Historically, the strongest upside phases have followed periods of skepticism, not optimism.

The anon’s $250,000 target for 2026 is not framed as sentiment or opinion, but as a continuation of prior cycle mechanics.

Whether the call proves right or wrong, the episode highlights a familiar pattern in Bitcoin markets. Short-term indicators often turn bearish well before long-term cycles conclude.

For now, Bitcoin price sits in an uncomfortable middle ground. 

Market Opportunity
TOP Network Logo
TOP Network Price(TOP)
$0.000096
$0.000096$0.000096
0.00%
USD
TOP Network (TOP) Live Price Chart
Disclaimer: The articles reposted on this site are sourced from public platforms and are provided for informational purposes only. They do not necessarily reflect the views of MEXC. All rights remain with the original authors. If you believe any content infringes on third-party rights, please contact service@support.mexc.com for removal. MEXC makes no guarantees regarding the accuracy, completeness, or timeliness of the content and is not responsible for any actions taken based on the information provided. The content does not constitute financial, legal, or other professional advice, nor should it be considered a recommendation or endorsement by MEXC.

You May Also Like

From random auctions to forward contracts, how does ETHGas transform block space into a priced resource?

From random auctions to forward contracts, how does ETHGas transform block space into a priced resource?

Key points: ETHGas redefines Ethereum block space as a priced resource, moving beyond transaction fees that fluctuate with demand. Through block space futures and
Share
PANews2025/12/26 14:00
Whales Dump 200 Million XRP in Just 2 Weeks – Is XRP’s Price on the Verge of Collapse?

Whales Dump 200 Million XRP in Just 2 Weeks – Is XRP’s Price on the Verge of Collapse?

Whales offload 200 million XRP leaving market uncertainty behind. XRP faces potential collapse as whales drive major price shifts. Is XRP’s future in danger after massive sell-off by whales? XRP’s price has been under intense pressure recently as whales reportedly offloaded a staggering 200 million XRP over the past two weeks. This massive sell-off has raised alarms across the cryptocurrency community, as many wonder if the market is on the brink of collapse or just undergoing a temporary correction. According to crypto analyst Ali (@ali_charts), this surge in whale activity correlates directly with the price fluctuations seen in the past few weeks. XRP experienced a sharp spike in late July and early August, but the price quickly reversed as whales began to sell their holdings in large quantities. The increased volume during this period highlights the intensity of the sell-off, leaving many traders to question the future of XRP’s value. Whales have offloaded around 200 million $XRP in the last two weeks! pic.twitter.com/MiSQPpDwZM — Ali (@ali_charts) September 17, 2025 Also Read: Shiba Inu’s Price Is at a Tipping Point: Will It Break or Crash Soon? Can XRP Recover or Is a Bigger Decline Ahead? As the market absorbs the effects of the whale offload, technical indicators suggest that XRP may be facing a period of consolidation. The Relative Strength Index (RSI), currently sitting at 53.05, signals a neutral market stance, indicating that XRP could move in either direction. This leaves traders uncertain whether the XRP will break above its current resistance levels or continue to fall as more whales sell off their holdings. Source: Tradingview Additionally, the Bollinger Bands, suggest that XRP is nearing the upper limits of its range. This often points to a potential slowdown or pullback in price, further raising concerns about the future direction of the XRP. With the price currently around $3.02, many are questioning whether XRP can regain its footing or if it will continue to decline. The Aftermath of Whale Activity: Is XRP’s Future in Danger? Despite the large sell-off, XRP is not yet showing signs of total collapse. However, the market remains fragile, and the price is likely to remain volatile in the coming days. With whales continuing to influence price movements, many investors are watching closely to see if this trend will reverse or intensify. The coming weeks will be critical for determining whether XRP can stabilize or face further declines. The combination of whale offloading and technical indicators suggest that XRP’s price is at a crossroads. Traders and investors alike are waiting for clear signals to determine if the XRP will bounce back or continue its downward trajectory. Also Read: Metaplanet’s Bold Move: $15M U.S. Subsidiary to Supercharge Bitcoin Strategy The post Whales Dump 200 Million XRP in Just 2 Weeks – Is XRP’s Price on the Verge of Collapse? appeared first on 36Crypto.
Share
Coinstats2025/09/17 23:42
zkPass Listing: Upbit’s Strategic Move to Boost Privacy-Focused Crypto Adoption

zkPass Listing: Upbit’s Strategic Move to Boost Privacy-Focused Crypto Adoption

BitcoinWorld zkPass Listing: Upbit’s Strategic Move to Boost Privacy-Focused Crypto Adoption In a significant move for the privacy-focused cryptocurrency sector
Share
bitcoinworld2025/12/26 14:45