Ethereum price slowly forms a risky pattern as BlackRock launches ETH staking ETF

Ethereum’s price has risen for four consecutive days and is now hovering around the crucial support level of $2,000, as BlackRock launches its first staking ETF today, March 12.
- BlackRock will launch ETHB today, its first staking Ethereum ETF.
- ETHB will have an expense ratio of 0.25%, making it a better option than ETHA.
- Ethereum has formed a bearish flag pattern, pointing to a retreat.
Ethereum (ETH), the second-biggest cryptocurrency, trades at $2,056, inside a range it has remained in in the past 30 days. This price is nearly 60% below its all-time high.
A major catalyst for ETH price is that BlackRock, the world’s biggest asset manager, will launch its staking ETF today. This is a big milestone that will address a key challenge that has existed in the existing funds.
Existing Ethereum ETFs, which have over $11.85 billion in assets, don’t offer staking rewards, making them less ideal to most investors. In BlackRock’s case, holders of the ETHA ETF pay an annual fee of 0.25% and forego a monthly return. Data shows that Ethereum has a staking return of about 3%.
The new ETF will have a ticker of ETHB and an annual fee of 0.25%. It will initially have a fee waiver of 0.12% for the first year or when it hits $2.5 billion in assets.
Therefore, a likely scenario is where there is a rotation from ETHA and other Ethereum ETFs to ETHB. It may also lead to more inflows from investors who have not invested in these funds yet.
Ethereum price prediction
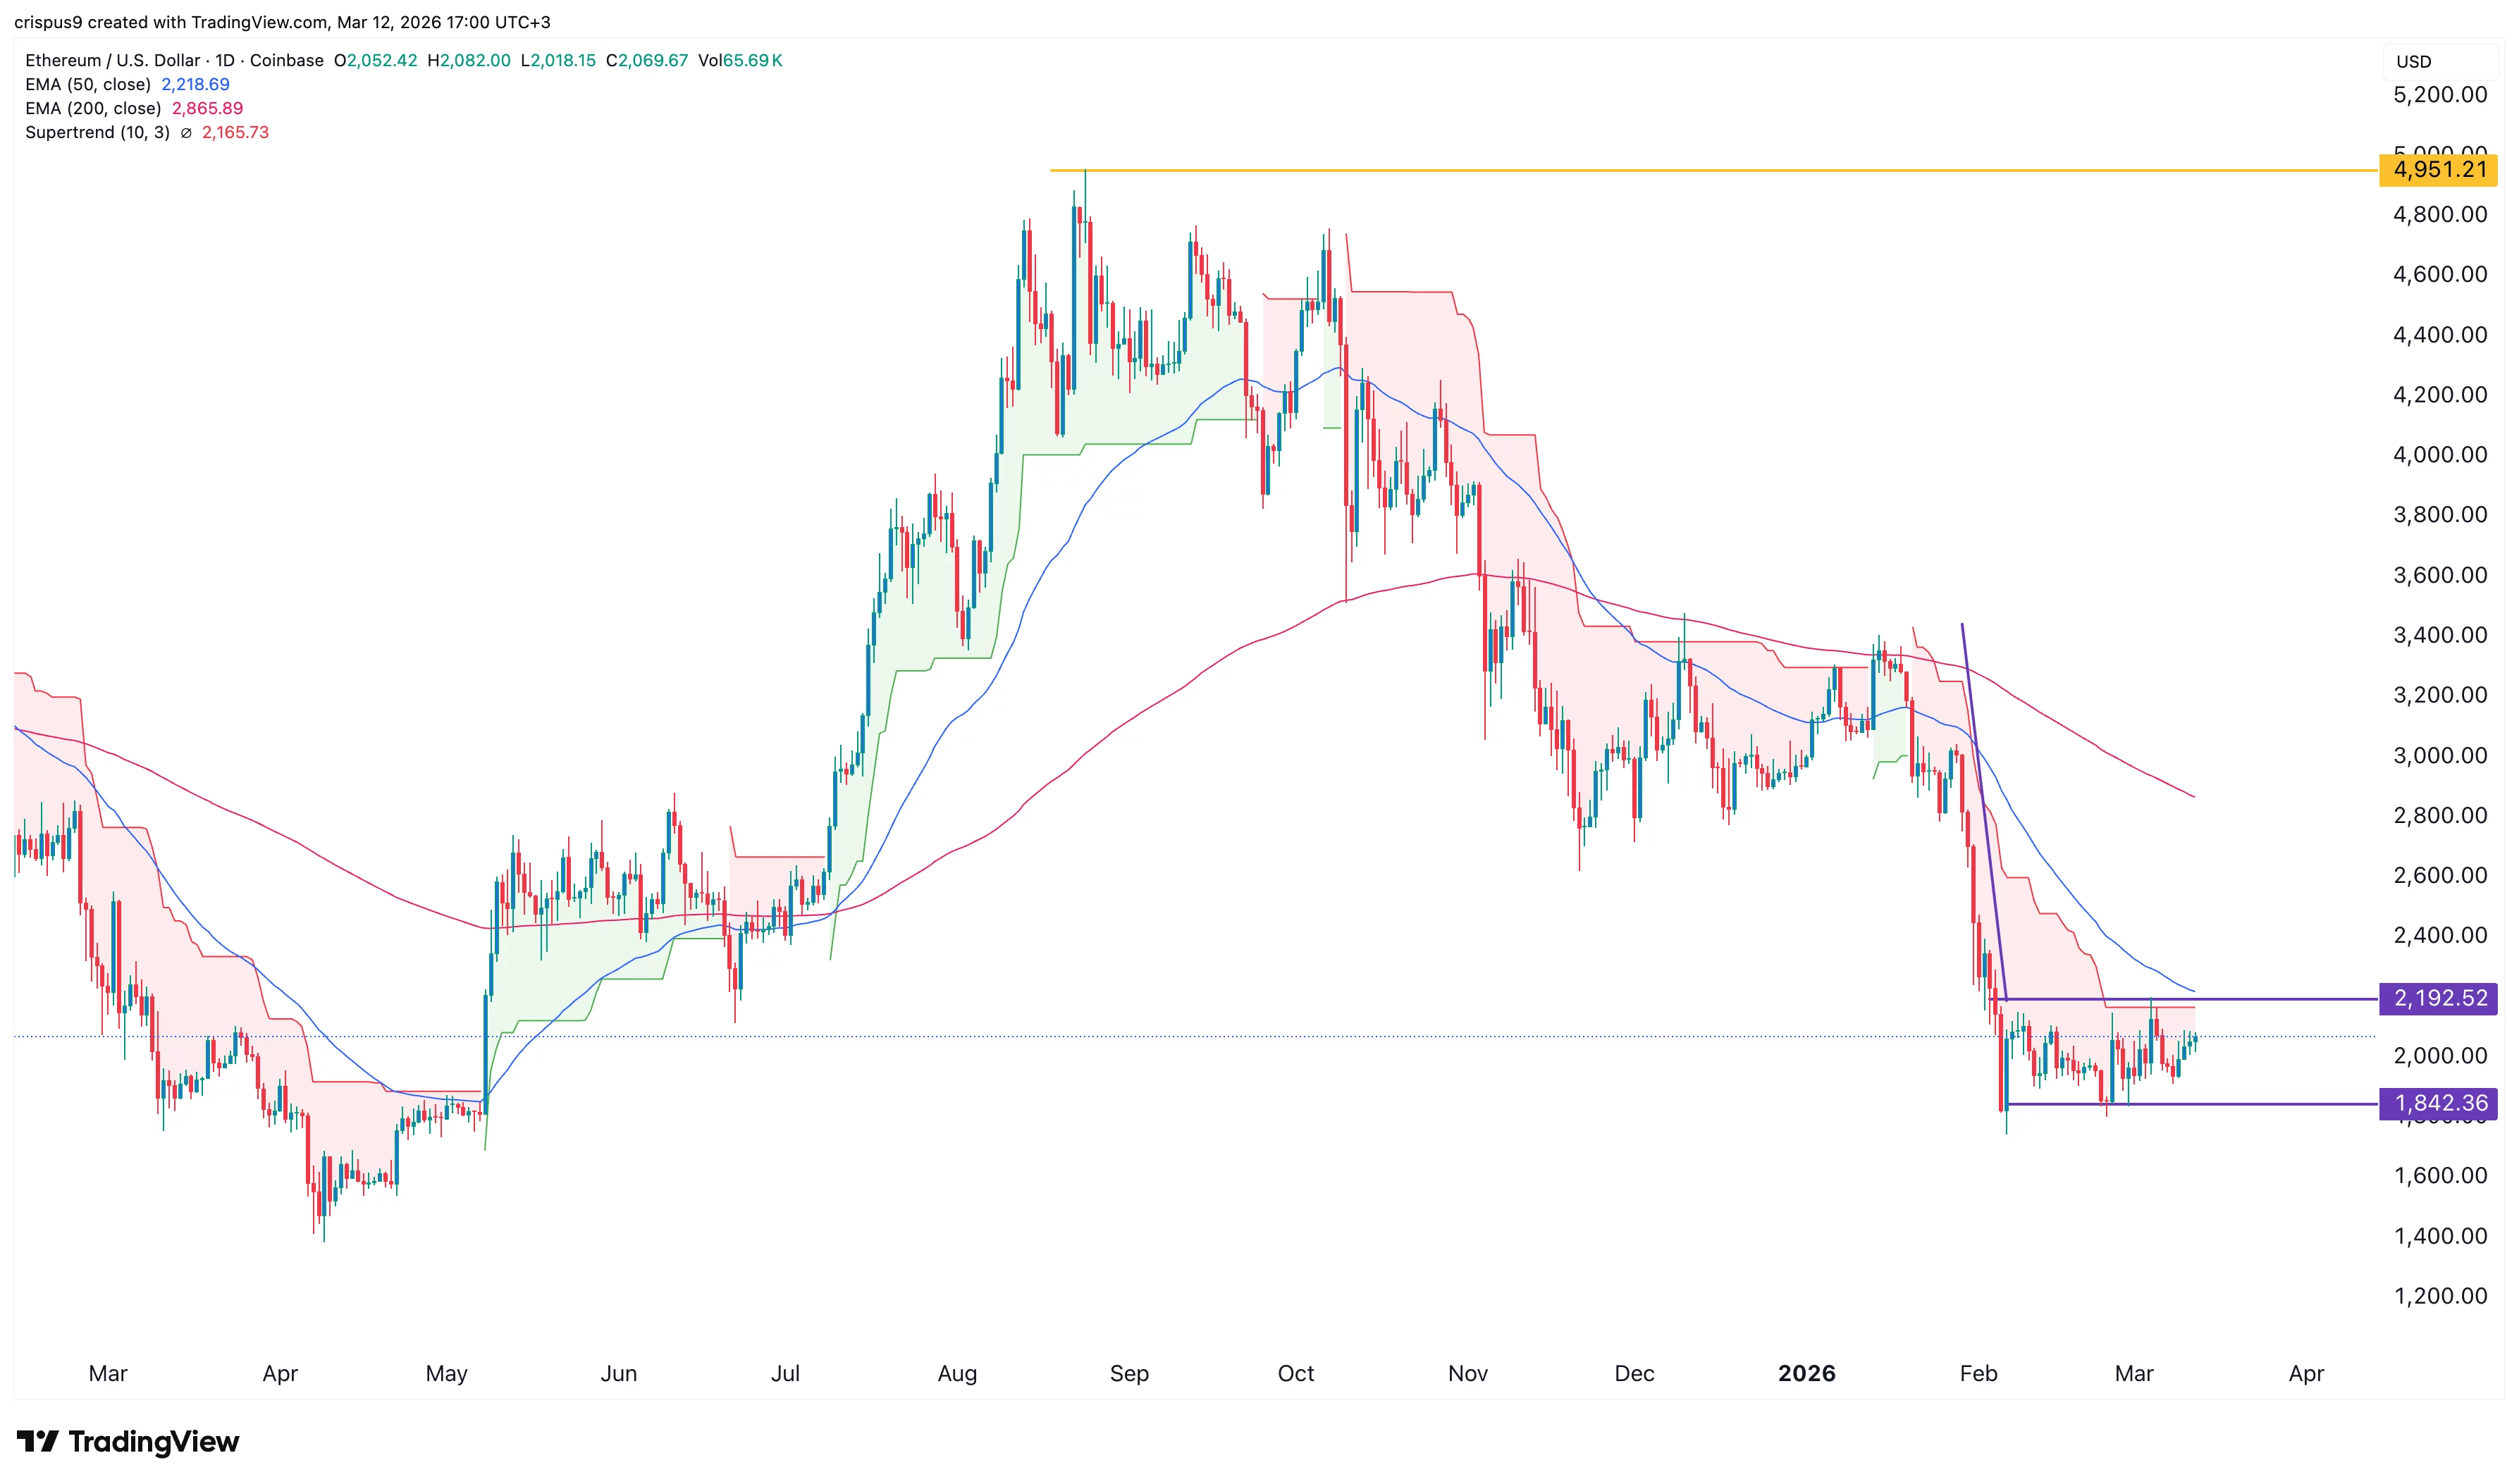
The daily timeframe chart shows that the ETH price crashed from the all-time high of $4,950 to the current $2,065. It has constantly remained below the 50-day and 200-day moving averages since November last year when it formed a death cross pattern.
Ethereum price has formed a horizontal channel whose support and resistance levels are at $1,843 and $2,193. It has remained inside this channel since February 6 this year.
This channel formed after the coin declined sharply, meaning that this is part of a bearish flag pattern. In most cases, this pattern often leads to a strong bearish breakout.
Therefore, the coin will likely have a strong bearish breakout in the near term. If this happens, the initial target will be the lower side of the channel at $1,843. A drop below that price will lead to further downside, potentially to $1,500.
Potrebbe anche piacerti

Stephen Gregory named binance us ceo as exchange targets expansion in US crypto market

The Growing World of Medical Aesthetics: Enhancing Beauty Through Science and Innovation