Oil Prices Plunge: Energy Markets Rally on Iran Conflict Optimism – ING Analysis
BitcoinWorld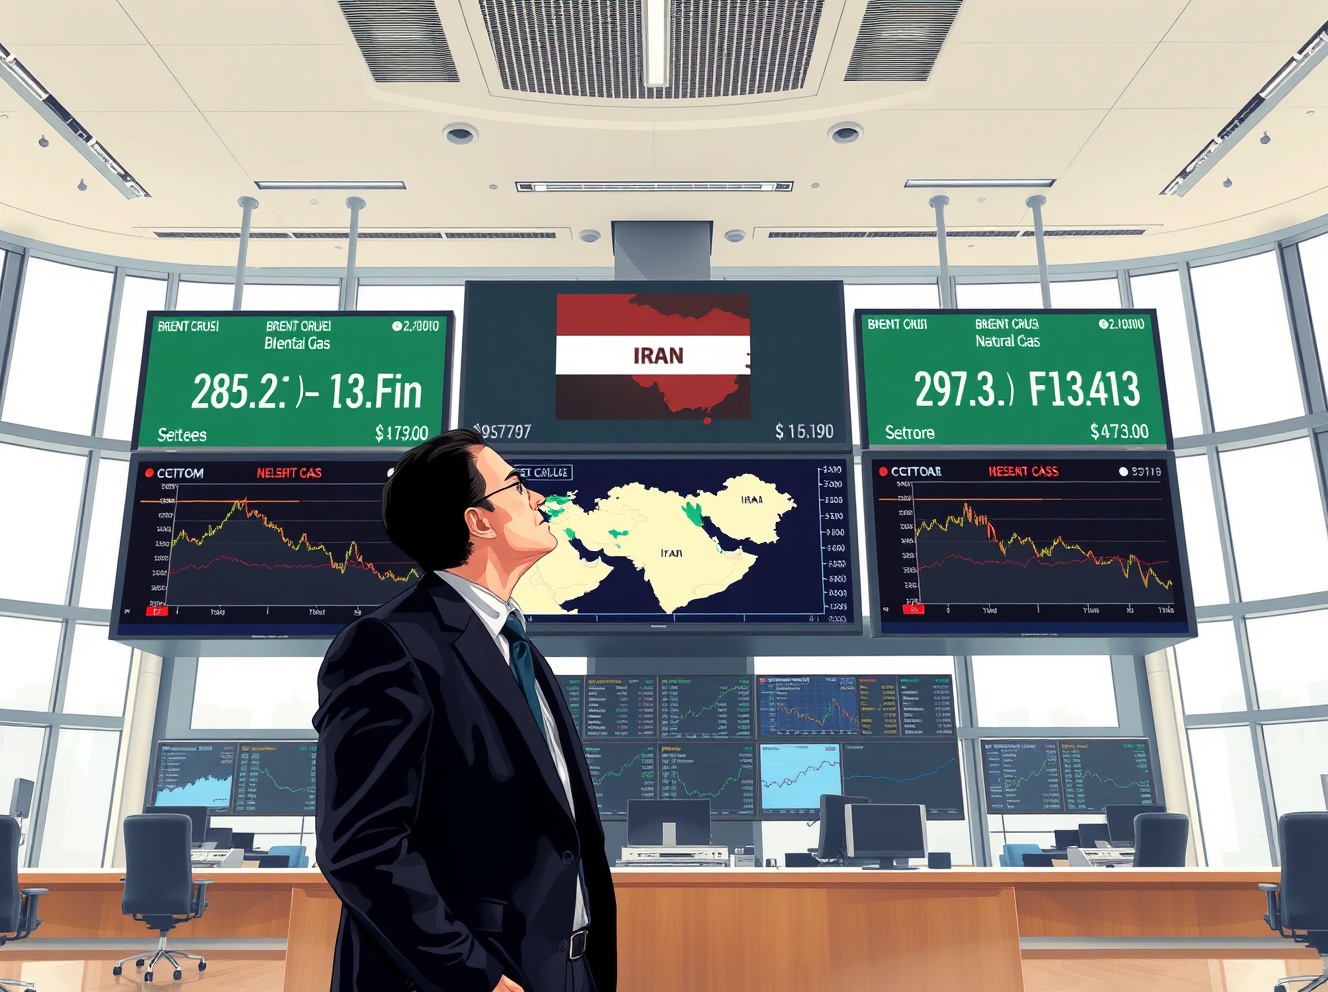
Oil Prices Plunge: Energy Markets Rally on Iran Conflict Optimism – ING Analysis
Global energy markets experienced significant downward pressure this week as oil and gas prices fell sharply amid growing optimism about potential de-escalation in Middle Eastern conflicts, according to analysis from ING Bank. The price movements reflect shifting market sentiment following diplomatic developments involving Iran and regional stakeholders.
Oil Prices Decline Amid Geopolitical Shifts
Brent crude futures dropped approximately 4.2% during Tuesday’s trading session, marking the steepest single-day decline in three weeks. Similarly, West Texas Intermediate (WTI) crude followed this downward trajectory with a 3.8% decrease. Natural gas prices also retreated across major benchmarks, including Henry Hub and TTF contracts. These movements occurred despite ongoing production cuts from OPEC+ members and seasonal demand factors that typically support higher energy prices during this period.
The price declines coincided with diplomatic communications between Iranian officials and international mediators. Market analysts immediately noted the correlation between these developments and energy market reactions. Furthermore, shipping data from the Strait of Hormuz showed increased vessel traffic, suggesting reduced immediate supply disruption risks. Energy traders typically price geopolitical risk premiums into oil contracts, and these premiums appear to be contracting based on current assessments.
Market Context and Historical Comparisons
Current price movements must be understood within broader market contexts. Energy markets have remained volatile throughout 2024 due to multiple intersecting factors:
- Supply Dynamics: OPEC+ maintains production cuts exceeding 2 million barrels per day
- Demand Patterns: Asian economic recovery continues at varied paces across different nations
- Alternative Energy: Renewable adoption affects long-term fossil fuel demand projections
- Storage Levels: Global petroleum inventories remain below five-year averages
Historical data reveals that Middle Eastern geopolitical events typically add $5-$15 per barrel to oil prices as risk premiums. The current decline suggests markets are pricing in reduced conflict probability. For comparison, during similar diplomatic breakthroughs in previous decades, oil prices typically corrected 6-12% over subsequent trading weeks. The current adjustment appears consistent with these historical patterns when accounting for contemporary market structures.
ING’s Analytical Framework
ING commodities analysts employ a multi-factor model when assessing energy price movements. Their methodology incorporates both quantitative data and qualitative geopolitical assessment. The bank’s research division monitors over 50 distinct variables affecting energy markets, weighting them according to current relevance. This week’s analysis highlighted several key indicators:
| Indicator | Current Status | Market Impact |
|---|---|---|
| Geopolitical Risk Index | Declining | Negative for prices |
| Shipping Insurance Rates | Stable | Neutral to negative |
| Options Market Sentiment | Bearish shift | Negative for prices |
| Physical Market Spreads | Narrowing | Negative for prices |
The bank’s analysts emphasize that while diplomatic progress appears promising, fundamental supply-demand balances remain tight. Consequently, they caution against interpreting current movements as the beginning of a sustained bear market. Instead, they characterize the price action as a normalization of excessive risk premiums that had built up during previous months of heightened tensions.
Regional and Global Implications
Price declines in energy markets create immediate consequences across multiple sectors and regions. For net energy importers, particularly in Europe and developing Asia, lower prices provide economic relief. Consumer energy costs may decrease in coming months if wholesale price reductions translate to retail markets. Additionally, manufacturing sectors with high energy intensity could see improved margin prospects.
Conversely, energy-exporting nations face revenue challenges from these price movements. Several national budgets in the Middle East and other producing regions assume specific price levels for fiscal planning. Significant deviations from these assumptions necessitate policy adjustments. Meanwhile, energy companies must reassess investment decisions, particularly for marginal projects with higher break-even requirements.
The transportation sector responds particularly sensitively to fuel price changes. Airlines typically hedge fuel costs months in advance, but spot price movements affect operational planning. Similarly, shipping companies adjust freight rates based on bunker fuel expenses. These secondary effects ripple through global supply chains, potentially affecting consumer goods pricing in subsequent quarters.
Expert Perspectives on Market Sustainability
Market analysts beyond ING offer varied perspectives on whether current price trends will persist. Some emphasize that diplomatic processes remain fragile and reversible. Others note that structural supply constraints continue to underpin markets regardless of geopolitical developments. Most experts agree that several factors will determine medium-term price directions:
- Verifiable implementation of diplomatic agreements
- OPEC+ production policy decisions at upcoming meetings
- Global economic growth trajectories and energy demand
- Strategic petroleum reserve management by consuming nations
- Weather patterns affecting both demand and production
Energy economists generally recommend monitoring physical market indicators rather than focusing exclusively on financial market movements. Tanker tracking data, refinery utilization rates, and inventory reports provide more reliable fundamental signals than futures price fluctuations alone. These metrics will become increasingly important as markets digest the geopolitical developments.
Conclusion
Oil and gas prices have declined significantly amid growing optimism about conflict resolution involving Iran, according to ING analysis. These movements reflect market reassessment of geopolitical risk premiums rather than fundamental supply-demand shifts. While diplomatic progress offers hope for regional stability, energy markets remain susceptible to multiple influencing factors. Market participants should monitor both geopolitical developments and physical market indicators when assessing future price directions. The current price adjustment demonstrates how sensitive energy markets remain to Middle Eastern geopolitical dynamics, even as global energy transitions progress.
FAQs
Q1: Why did oil prices fall specifically this week?
Oil prices declined due to market perceptions of reduced geopolitical risk following diplomatic communications regarding Iran. Traders adjusted positions based on expectations of improved regional stability and reduced supply disruption risks.
Q2: How much did prices actually decrease?
Brent crude futures fell approximately 4.2%, while WTI declined about 3.8% during the key trading session. Natural gas prices showed similar downward movements across major global benchmarks.
Q3: Will these lower prices continue long-term?
Market analysts express cautious views about sustainability. While geopolitical improvements support lower prices, fundamental supply constraints and seasonal demand factors may provide support at lower price levels.
Q4: How does this affect consumers and businesses?
Lower wholesale energy prices may eventually translate to reduced costs for transportation, manufacturing, and heating. However, the timing and magnitude of consumer impacts depend on multiple factors including retail market structures and tax policies.
Q5: What should investors watch next?
Key indicators include verified diplomatic progress, OPEC+ production decisions, global inventory data, and physical market spreads between different crude grades and delivery locations.
This post Oil Prices Plunge: Energy Markets Rally on Iran Conflict Optimism – ING Analysis first appeared on BitcoinWorld.


Potrebbe anche piacerti

This week, NFT transaction volume rebounded by 1.27% to US$108.6 million, and the number of buyers and sellers increased by more than 50%.

XRP’s ‘True Value’ Could Be $32, Says BlackRock Executive