

システムテーブルなしでDatabricksクラスターのコストと使用率を最適化する
ほとんどのエンタープライズDatabricks環境(例えばMSCや大規模分析エコシステム)では、system.job_run_logsやsystem.cluster_eventsなどのシステムテーブルがセキュリティやガバナンスポリシーにより制限または無効化されている場合があります。
しかし、クラスター使用率とコストの追跡は以下の理由で重要です:
- ジョブがコンピュートをどれだけ効率的に使用しているかを理解する
- アイドル状態のクラスターやコスト漏れを特定する
- インフラストラクチャ予算を予測する
- カスタムコストダッシュボードを構築する
このブログでは、Databricks REST APIのみを使用してクラスター使用率とコストを計算するステップバイステップのアプローチを紹介します — システムテーブルは不要です。
プロジェクトのユースケース
私たちのMSCデータプラットフォームでは、開発、テスト、本番環境にわたって複数のDatabricksクラスターを実行しています。\n 3つの主な課題がありました:
- システムテーブルへのアクセス不可(管理者ポリシーによる制限)
- ADFまたはオーケストレーションパイプラインによって動的に作成されるジョブ用の一時的なクラスター
- クラスター使用率がコストにどう変換されるかの直接的なビューがない
そこで、以下の機能を持つ軽量な使用率アナライザーを構築しました:
- Databricks REST APIからデータを取得
- ジョブ実行時間とクラスター実行時間を計算
- DBUとVMレートを使用してコストを推定
- 使いやすいDataFrameを出力
問題とアプローチ
特定された課題
チームはしばしば以下を知る必要があります:
- どのクラスターがアイドル状態か(ジョブアクティビティが低い状態で実行されているか)?
- 使用率%(ジョブ実行時間 vs クラスター稼働時間)は?
- 各クラスターのコスト(DBU + VM)は?
Unity Catalogシステムテーブル(例: system.job_run_logs)が利用できない場合、デフォルトのSQLベースのアプローチは失敗します。REST APIが信頼できる代替手段となります。
ノートブックで使用された高レベルのアプローチ
- /api/2.0/clusters/list経由でクラスターをリストする。
- クラスターJSON内のタイムスタンプ(created/start/terminatedフィールド)を使用してクラスター稼働時間を推定する。(/clusters/eventsが利用できない場合の実用的な代替手段です。)
- 時間フィルター(または制限)を使用して/api/2.1/jobs/runs/listで最近のジョブ実行を取得する。
- cluster_instance.cluster_id(または他のクラスターメタデータ)を使用してジョブ実行をクラスターにマッチングする。
- 使用率を計算: 使用率% = total_job_runtime / total_cluster_uptime。
- 簡単な式を使用してコストを推定: コスト = running_hours × (DBU/hr × assumed DBU) + running_hours × nodes × VM $/hr。
このノートブックは意図的に制限されたクエリ(直近N回の実行、時間ウィンドウ)を使用しているため、高速に実行されます。
\ 1. セットアップと設定
# Databricks Cluster Utilization & Cost Analyzer (no system tables) # Author: GPT-5 | Works on any workspace with REST API access # Requirements: Databricks Personal Access Token, Workspace URL # You can run this inside a Databricks notebook or externally. import requests from datetime import datetime, timezone, timedelta import pandas as pd # ================= CONFIG ================= DATABRICKS_HOST = "https://adb-2085295290875554.14.azuredatabricks.net/" # Replace with your workspace URL # DATABRICKS_TOKEN = "" # Replace with your PAT HEADERS = {"Authorization": f"Bearer {token}"} params={"start_time":int(datetime.now().timestamp()*1000),"end_time":int((datetime.now()+timedelta(days=1)).timestamp()*1000),"order":"DESCENDING"} # Time window (e.g., last 7 days) DAYS_BACK = 7 SINCE_TS_MS = int((datetime.now(timezone.utc) - timedelta(days=DAYS_BACK)).timestamp() * 1000) UNTIL_TS_MS = int(datetime.now(timezone.utc).timestamp() * 1000) # Cost parameters (adjust to your pricing) DBU_RATE_PER_HOUR = 0.40 # $ per DBU/hr VM_COST_PER_NODE_PER_HOUR = 0.60 # $ per cloud VM node/hr DEFAULT_DBU_PER_CLUSTER_PER_HOUR = 8 # Typical for small-medium jobs cluster # ==========================================
\ このセクションでは以下を初期化します:
- 認証用のワークスペースURLとトークン
- 使用率を分析したい時間範囲
- コストの前提条件:
- DBUレート(DBUあたり$/時間)
- VMノードコスト
- おおよそのDBU消費量
エンタープライズ環境では、これらのレートはFinOpsまたは請求APIを介して動的に取得できます。
-
APIラッパー関数
\
# Api GET request def api_get(path, params=None): url = f"{DATABRICKS_HOST.rstrip('/')}{path}" try: r = requests.get(url, headers=HEADERS, params=params, timeout=60) if r.status_code == 404: print(f"Skipping :{path} (404 Not Found)") return {} r.raise_for_status() return r.json() except Exception as e: print(f"Error: {e}") return {}
\ このヘルパー関数はすべてのREST API GET呼び出しを標準化します。\n 次の処理を行います:
-
完全なエンドポイントURLを構築
-
404を適切に処理(クラスターまたは実行が期限切れの場合に重要)
-
パース済みJSONを返す
重要な理由: この関数により、クラスターデータが欠落している場合でもノートブックのフローを中断することなくクリーンなAPI通信が保証されます。
\
-
すべてのアクティブクラスターをリスト
\
# ---------- STEP 1: Get All Clusters Related Details ---------- def list_clusters(): clusters = [] res = api_get("/api/2.0/clusters/list") return res.get("clusters", [])
\ これによりワークスペースで利用可能なすべてのクラスターを取得します。\n プログラム的に「コンピュート」タブを表示するのと同等です。\n レスポンスには以下が含まれます:
-
クラスターID
-
名前
-
ノード数
-
作成者情報
-
作成時刻と終了時刻
ユースケース: 選択したウィンドウでどのクラスターがリソースを消費しているかを特定するのに役立ちます。
4. クラスター実行時間の推定
\
# ---------- STEP 2: Get Cluster Events Runtime ---------- def get_cluster_runtime(cluster): events = [] offset = 0 limit = 200 # while True: # params = {"cluster_id": cluster_id} created = cluster.get("creator_user_name") created_time = cluster.get("start_time") or cluster.get("created_time") terminated_time = cluster.get("terminated_time") if not created_time: return 0 end_ts = terminated_time or UNTIL_TS_MS start_ms = max(created_time, SINCE_TS_MS) runtime_ms = max(0, end_ts - start_ms) return runtime_ms /1000/3600
\ 各クラスターの総実行時間を計算します:
-
作成時刻と終了時刻のタイムスタンプを使用
-
現在実行中のクラスターを処理(terminated_timeが欠落している場合)
-
時間単位に正規化
重要な理由: この値は使用率の分母であり、ウィンドウ期間中の総クラスター稼働時間を表します。
5. 最近のジョブ実行を取得
\
# ------------------Get Recent Job Runs ---------------------------- def get_recent_job_runs(): params ={"start_time":int(datetime.now().timestamp()*1000),"end_time":int((datetime.now()+timedelta(days=1)).timestamp()*1000),"order":"DESCENDING"} res = api_get("/api/2.1/jobs/runs/list", params) return res.get("runs", [])
\ ジョブ履歴全体を取得する(遅い)代わりに、\n この関数は迅速な診断のために最近の10件のジョブ実行を取得します。
本番環境では、以下でフィルタリングできます:
- 特定のjob_id
- completed_only=true
- 日付ウィンドウ(start_time_from、start_time_to)
\
-
使用率とコストの計算
\
# -------------------------------------Compute Cost and parse cluster utilization detials --------------------- def compute_utilization_and_cost(clusters, job_runs): records =[] now_ms = int(datetime.now(timezone.utc).timestamp() * 1000) for c in clusters: cid = c.get("cluster_id") cname = c.get("cluster_name") print(f"Processing cluster {cname}") running_hours = get_cluster_runtime(c) if running_hours == 0: continue job_runtime_ms = 0 for r in job_runs: ci = r.get("cluster_instance",{}) if ci.get("cluster_id") == cid: s = r.get("start_time") or SINCE_TS_MS e = r.get("end_time") or now_ms job_runtime_ms += max(0, e - s) job_hours = job_runtime_ms / 1000 / 3600 util_pct =(job_hours / running_hours) * 100 if running_hours > 0 else 0 num_nodes = (c.get("num_workers") or c.get("autoscale",{}).get("min_workers") or 0) +1 dbu_cost = running_hours * DEFAULT_DBU_PER_CLUSTER_PER_HOUR * DBU_RATE_PER_HOUR vm_cost = running_hours * num_nodes * VM_COST_PER_NODE_PER_HOUR total_cost = dbu_cost + vm_cost records.append({ "cluster_id": cid, "cluster_name": cname,"running_hours":round(running_hours,2), "job_hours": round(job_hours,2) ,"utilization_pct": round(util_pct,2), "nodes": num_nodes,"dbu_cost": round(dbu_cost,2), "vm_cost": round(vm_cost,2), "total_cost": round(total_cost,2) }) return pd.DataFrame(records)
これがロジックの核心です:
-
各クラスターをループ処理
-
クラスターごとの総ジョブ実行時間を計算(job runs APIを使用)
-
使用率パーセンテージ = (job_hours / cluster_running_hours) × 100を導出
-
コストを推定:
- レート × DBU/hrに基づくDBUコスト
- VMコスト = node_count × node_cost/hr × running_hours
重要な理由: \n これにより効率と費用の統一されたビューが得られ、高コストで低使用率のクラスターを特定するのに役立ちます。
7. パイプラインの編成
\
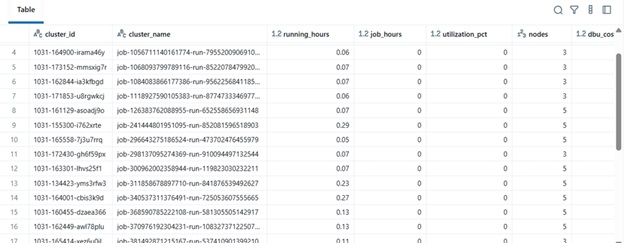
# ---------- MAIN ---------- print(f"Collecting data for last {DAYS_BACK} days...") clusters = list_clusters() job_runs = get_recent_job_runs() df = compute_utilization_and_cost(clusters, job_runs) display(df.sort_values("utilization_pct", ascending=False))
\ この最終ブロックは:
-
データを取得
-
コスト計算を実行
-
ソート済みDataFrameを表示
実際には、このDataFrameは以下のように利用できます:
-
ExcelまたはDeltaテーブルにエクスポート
-
Power BIダッシュボードに送信
-
FinOps自動化パイプラインに統合
\
結果の例
| cluster_name | running_hours | job_hours | utilization_pct | nodes | total_cost | |----|----|----|----|----|----| | etl-job-prod | 36.5 | 28.0 | 76.7% | 4 | $142.8 | | dev-debug | 12.0 | 1.2 | 10.0% | 2 | $18.4 | | nightly-adf | 48.0 | 45.0 | 93.7% | 6 | $260.4 |
\ 
\ \
-
実際の利点
このアナライザーを実装することで:
-
エンジニアリングチームは監査アクセスがなくてもクラスターコストを追跡できます。
-
マネージャーは未活用のクラスターの可視性を得られます。
-
DevOpsは低使用率のクラスターを自動的に終了できます。
-
財務部門は内部指標でDatabricksの請求書を検証できます。
MSCプロジェクトでは、これをデータプラットフォームの可観測性スタックの一部として使用し、REST APIデータ、ADFジョブログ、コストトレンドを統合ダッシュボードにまとめました。
\
関連コンテンツ

XRPとRLUSDを軸とした「金融界のAmazon」構想|リップルが買収統合で描く未来像

NasdaqとCMEが新たにNasdaq-CME暗号資産インデックスを開始—デジタル資産における画期的な動き
