

Binance Alpha Points "Shura Field": A Web3 Wallet War That Swallowed 90% of the Market Share
Author: Frank, PANews
Recently, Binance Web3 Wallet has created a huge wave in the Web3 wallet market with its innovative "Alpha" gameplay, and its market share has risen sharply, accounting for 90% of the market, which is remarkable. Behind this phenomenon is its sophisticated points airdrop mechanism, the strategic adjustment of competitors, and the chain reaction and significant recovery of the BNB Chain ecosystem caused by it.
How does Binance Alpha cleverly take advantage of market vacancies and user psychology to achieve "whale-swallowing" expansion? Under the appearance of "gold rush", what are the "involution" pressures and real benefits faced by users? Is this a short-lived traffic carnival, or a model innovation that can lead to industry change?
Opponents' free time and points play methods are eating up the wallet market
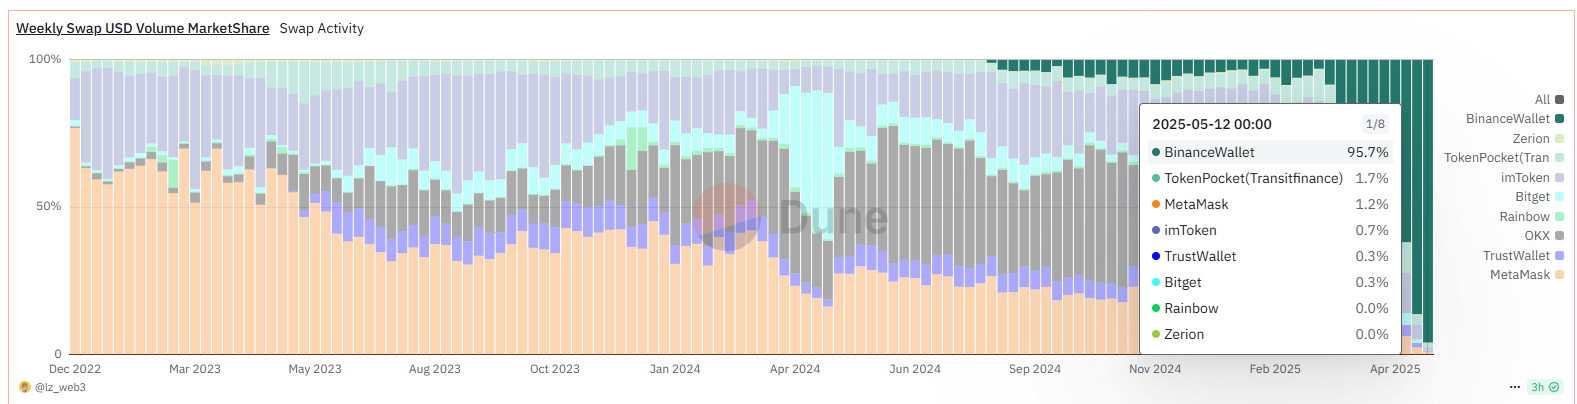
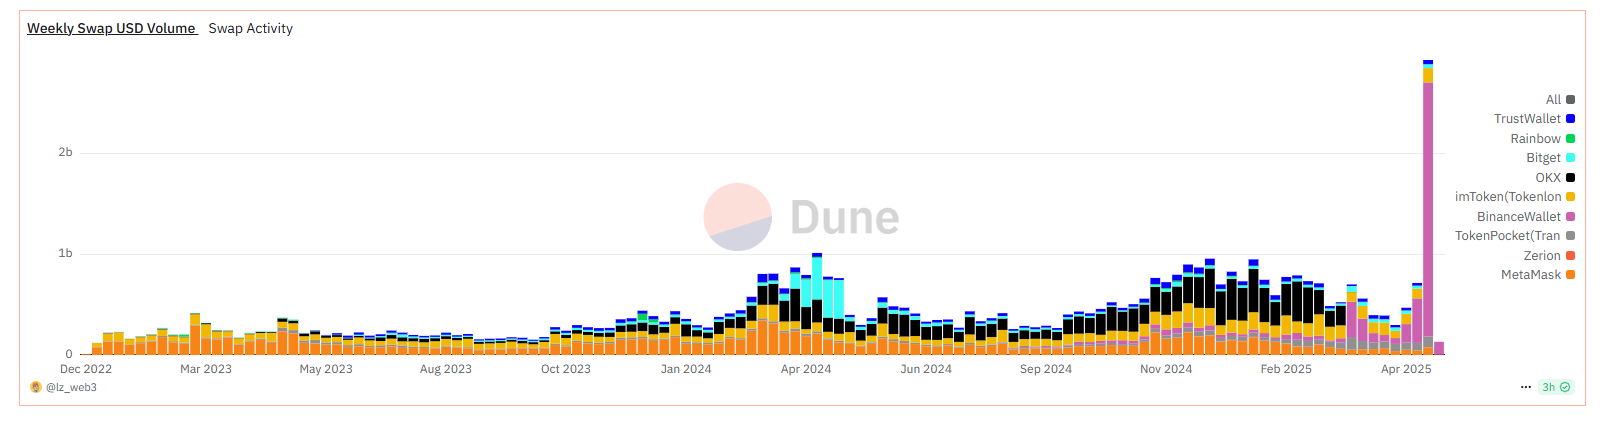
Since its launch, Binance Web3 Wallet's market share has exploded. Dune data shows that by May 12, 2025, Binance Web3 Wallet accounted for 95.7% of the total transaction volume of all tracked Web3 wallets, ranking first. This is a significant jump from 54.1% in March 2025. On May 10, 2025, Binance Wallet's peak daily transaction volume exceeded US$930 million, while on April 22, this figure was only US$76 million.
BNB Chain's ecological activity has also been boosted by Alpha. BNB Chain's TVL has also increased significantly, with an increase of more than $6 billion from the beginning of 2024 to May 2025. This is inseparable from the improvement of Binance Alpha. According to official data, half of the top 20 Alpha tokens in terms of trading volume are BSC native projects. Among the top 10 Alpha tokens in terms of new active users, 90% are BSC tokens, of which 6 projects have a new user share of more than 20%. The on-chain BSC data has also increased significantly: about 4.3 million new users in the past week, more than 1 million new addresses per day for two consecutive days, and more than 2 million active addresses. The total number of BSC independent addresses has reached 552 million. Judging from these data, Binance Alpha is becoming an important engine for BNB Chain activity and capital inflows.
It is worth noting that the sharp increase in Binance Web3 wallet market share is highly consistent with the time when competitor OKX suspended its DEX aggregator service. On March 17 this year, OKX announced the suspension of DEX product aggregator trading services, and then the OKX wallet market share plummeted from about 50% to 3.6%. Almost at the same time, on March 18, Binance announced the launch of the Binance Alpha2.0 test version, integrating Alpha trading directly into the Binance exchange.
The data also shows obvious changes. From March 10 to March 17, Binance Wallet's transaction volume market share was only 8.3%. By March 24, Binance Wallet's market share increased to 50.2%, making it the wallet application with the highest market share.
On April 17, BinanceAlpha announced that it would launch the GM token and start the airdrop plan. The search index of BinanceAlpha began to rise rapidly, and its trading volume also changed significantly. The trading volume from April 17 to April 24 reached 184 million US dollars, more than three times the 57.94 million in the previous week. As the popularity of the point system on social media increased, the trading volume in the week ending May 5 reached 1.574 billion US dollars, a 27-fold increase from the week before the airdrop was launched. As a result, the wallet transaction volume on the entire chain was pushed to 1.876 billion US dollars, breaking the historical record.
The "sweetness" and "burden" of Alpha users
This explosive growth stems from the Binance Alpha points airdrop system. The Binance Alpha points system is a complex mechanism designed by Binance to motivate user participation, screen active users, and allocate airdrop or TGE qualifications. Points are mainly allocated based on the user's trading volume, balance and other data on Binance Alpha, and then in each airdrop event, a points threshold is set to determine which users can participate in the event.
However, with the surge in the number of users, this point-based gameplay is becoming a new involutionary battlefield. There are two key assessment indicators for this point-based mechanism: asset balance and daily trading volume.
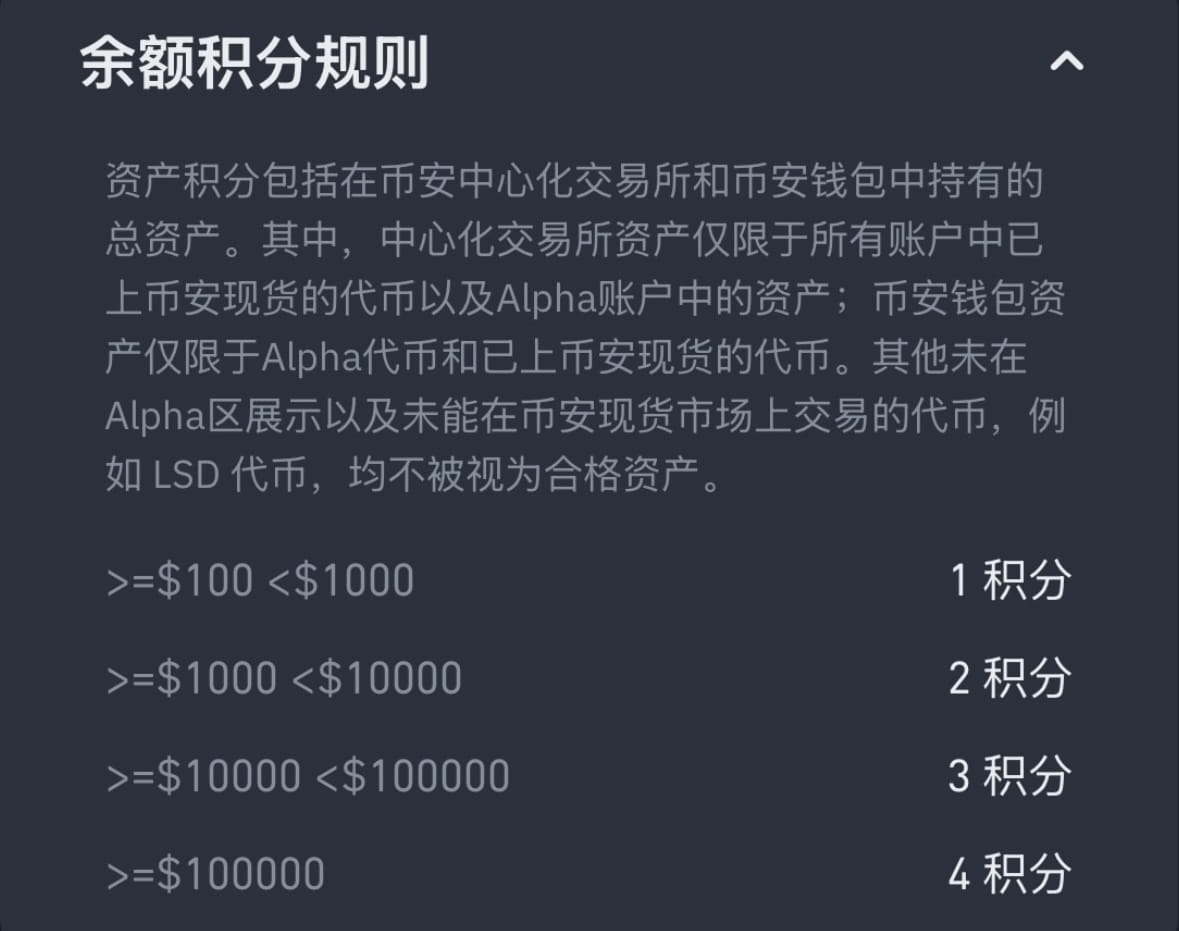
There are four levels based on asset balance: 1 point per day for total asset value of $100 to <$1,000; 2 points per day for total asset value of $1,000 to <$10,000; 3 points per day for total asset value of $10,000 to <$100,000; and 4 points per day for total asset value of $100,000 and above.
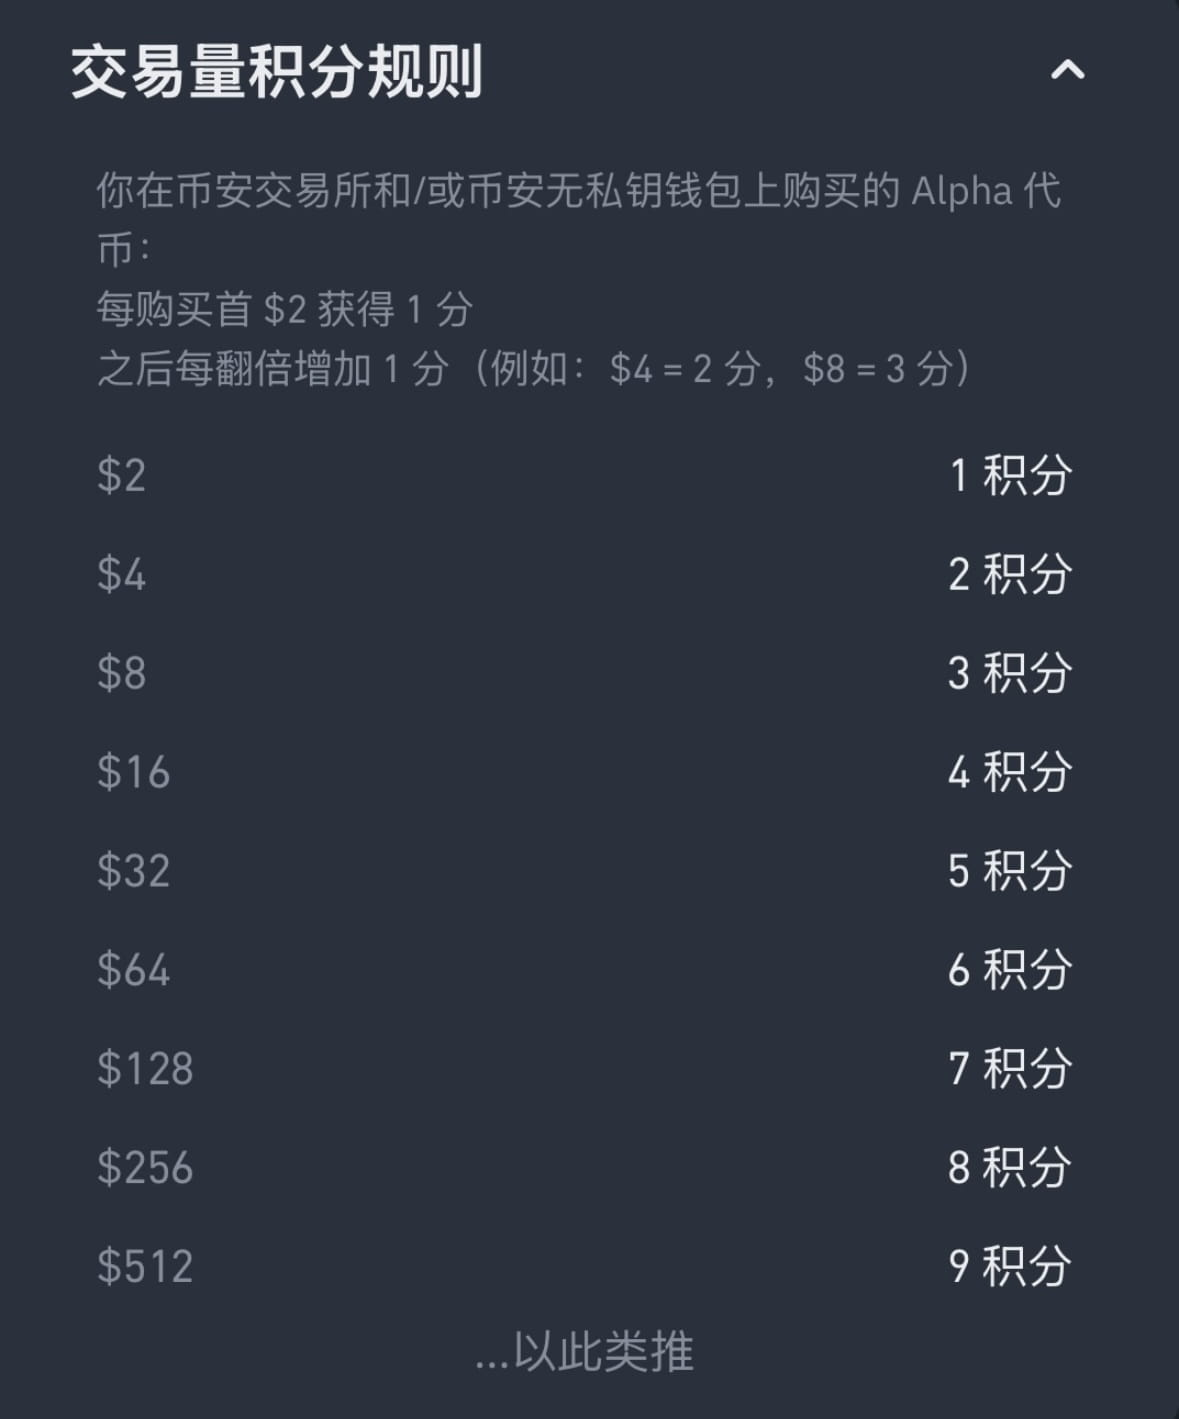
In terms of trading volume, buy $2 equivalent tokens: get 1 point; buy $4 equivalent tokens: get 2 points; buy $8 equivalent tokens: get 3 points; buy $16 equivalent tokens: get 4 points; buy $32 equivalent tokens: get 5 points, and then every time the purchase volume doubles, an additional 1 point will be added (for example, buy $64 to get 6 points, buy $128 to get 7 points, and so on). It is generally believed that trading $32 a day to get 5 points is a relatively cost-effective option.
In addition, these points are calculated on a rolling basis over 15 days, which means that users cannot do it once and for all, and need to continue to brush up their points to maintain their point level.
This point-based gameplay has several relatively obvious attractions for users. First, the rules are clear, and users can completely predict the number of points they can get based on their own strategies to catch up with the airdrop threshold. Second, there is basically no first-mover advantage under this point-based system, and later users can also participate and get a similar level of points as the first-mover users.
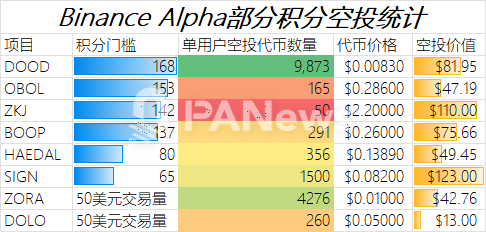
However, as the internal circulation intensifies, this threshold of points is constantly increasing. From the earliest $50 transaction volume or $100 asset balance standard to the latest project DOOD, it has been increased to 168 points. According to this standard, a new user needs to maintain a daily score of more than 11.2 points to participate in this airdrop. According to calculations, eligible users need to hold more than $1,000 and conduct more than $1,024 in transactions per day to accumulate enough airdrops. Including on-chain fees and transaction slippage costs, the total cost may reach more than $60. Compared with the final value of the airdrop of $81, it can get a rate of return of about 35%. However, the opportunity cost of the $1,000 principal must also be considered. Compared with the total capital investment, the 15-day rate of return is about 2%. This rate of return may not be as good as the increase in a token, but it is relatively more stable, so many hair-raising studios choose to make numbers in batches and invest in it.
Traffic carnival or paradigm revolution?
Is Binance Alpha, in fact, really a new type of airdrop?
DOOD's airdrop announcement revealed the user threshold that meets the requirements. A total of 30,271 accounts meet the requirements. Based on the airdrop amount of about $81 per account, the overall airdrop scale of this airdrop is about $2.48 million. The corresponding address data of other token airdrops was not disclosed, so the specific amount cannot be obtained, but the estimated scale should be similar. For a project airdrop, the scale of millions of dollars does not seem high, especially compared with the airdrop scale of hundreds of millions or even billions of dollars of Hyperliqued, Movement, etc., and is not even as high as the airdrop volume of a single large account.
However, judging from the publicity effect and the transaction data brought to the ecosystem, Binance Alpha's input-output ratio is undoubtedly impressive. In essence, this is similar to the trading mining that was popular a few years ago. With the obvious effect of Binance, many exchanges are also launching similar gameplay.
On May 7, Bybit announced the launch of the WEB3 Points Program, where users can earn WEB3 points by completing tasks such as holding crypto assets, conducting exchange transactions, and inviting friends.
On May 5, OKX Exchange announced a major functional upgrade to the DEX aggregator built into its self-hosted wallet OKX Wallet. It added a number of new features, including on-chain market analysis, smart fund tracking, and Meme mode. As of May 11, OKX Wallet's market share has rebounded to 8.5%.
As exchanges compete with each other for the wallet market, some traditional wallet applications have become the target of helplessness. In June 2023, MetaMask's trading volume market share can still reach more than 60%. By May 2025, it will only be 2.9%. Binance's Trust Wallet is also facing a similar dilemma.
In general, Binance Alpha has brought a new round of coin-pulling craze through the points system, which is similar to the liquidity mining of early exchanges, stimulating trading activities through potential incentives. On the one hand, it is an effective tool for ecological products such as Binance Wallet and BSC to gain market share and increase user activity. Through the carefully designed points and airdrop mechanism, it has successfully attracted a large number of users and funds. It even eroded the market share of competitors to a certain extent. There is an obvious positive correlation between the recovery of BNB Chain and the promotion of Alpha, forming an "Alpha-BNB Chain flywheel effect".
On the other hand, for users, the 15-day rolling points, point burning mechanism and the ever-increasing airdrop threshold force users into a kind of "Alpha treadmill"-style continuous high-intensity trading, whose real net income is often difficult to accurately measure, and faces many hidden costs such as slippage and gas fees. For many ordinary users, the "gold rush" may gradually evolve into a "sweatshop" model. The involution effect caused by this model is spreading from users to exchanges. If the input-output ratio of this airdrop drops below the profit line, then today's lively scene may also cool down quickly in a short period of time.
But for the industry, Binance Alpha’s mechanism design does have a lot to learn from, especially for projects that are expected to issue airdrops. Binance Alpha is a classic example of spending little money to achieve great things.
You May Also Like

Over 60% of crypto press releases linked to high-risk or scam projects: Report

ArtGis Finance Partners with MetaXR to Expand its DeFi Offerings in the Metaverse
