In this seemingly winner-takes-all feast, there is a view that its huge traffic is "overflowing" to other ecosystems such as Sui and Solana, injecting vitality into them. However, what is the true situation of this spillover effect? What kind of far-reaching impact will this "hair-pulling" carnival ignited by Binance Alpha ultimately have on the industry?In this seemingly winner-takes-all feast, there is a view that its huge traffic is "overflowing" to other ecosystems such as Sui and Solana, injecting vitality into them. However, what is the true situation of this spillover effect? What kind of far-reaching impact will this "hair-pulling" carnival ignited by Binance Alpha ultimately have on the industry?

Binance Alpha points are intensifying, but the truth is not so good

2025/05/15 17:56
8 min read

Author: Frank, PANews

Binance Alpha's points game is pushing "involution" to the extreme at an unprecedented speed. When the points threshold once exceeded the 200-point mark, and the airdrop income dropped sharply to around US$25, the decline in the user input-output ratio triggered widespread community discussion.

In this seemingly winner-takes-all feast, there is a view that its huge traffic is "overflowing" to other ecosystems such as Sui and Solana, injecting vitality into them. However, what is the true situation of this spillover effect? What kind of far-reaching impact will this "hair-pulling" carnival ignited by Binance Alpha ultimately have on the industry?

The reality and illusion of traffic “spillover”: Sui’s observation on the Alpha effect

The Binance Alpha points game mechanism has been introduced in detail in the previous article , so I will not repeat it here. But in general, as more and more users participate, the final result is that there is a clear upper limit to the income of each airdrop, and the threshold for points is getting higher and higher. In this case, users have to further reduce costs in order to retain profit margins.

Binance Alpha points are intensifying, but the truth is not so good

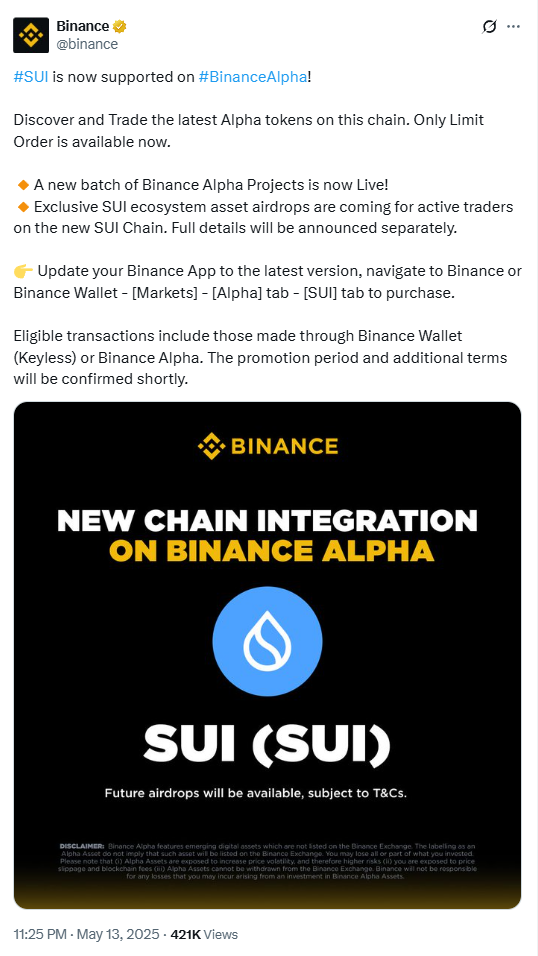
Recently, Binance Alpha started to list Sui ecosystem tokens. Subsequently, several Alpha projects of Sui ecosystem were announced. The addition of Sui ecosystem just provides a new cost trough for users who want to increase trading volume. On May 14, @lianyanshe and other KOLs proposed that projects such as NAVX of Sui ecosystem have lower gas fees when increasing trading volume, will not be attacked by clamp robots, and have lower overall wear and tear. Therefore, several projects of Sui ecosystem will become the "new volume kings" of Binance Alpha.

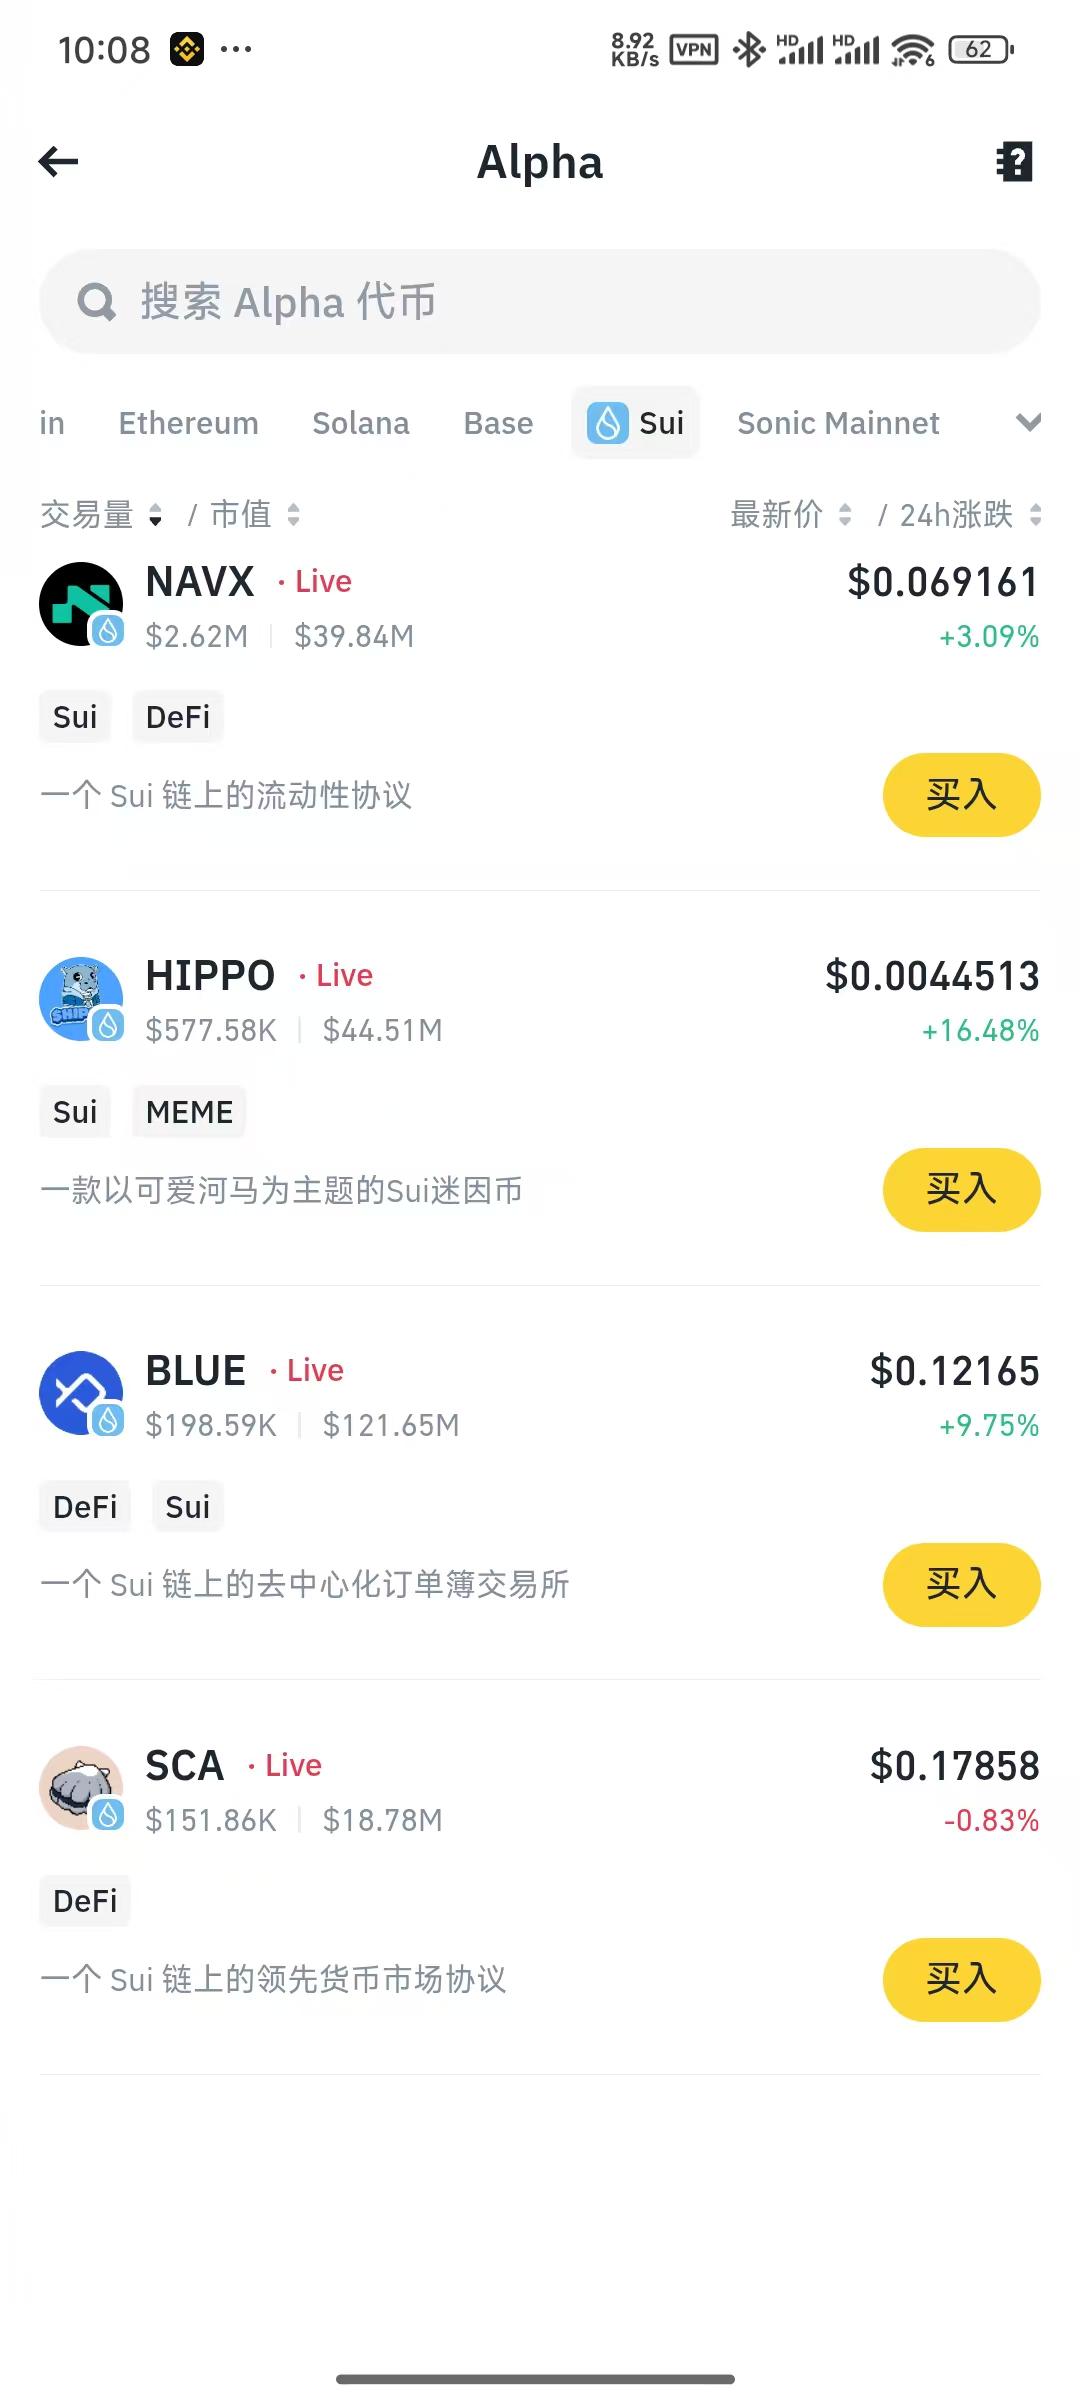
If most users choose this form, it can indeed bring a lot of trading volume and token popularity to the Sui ecosystem. However, in reality, there seems to be no similar effect. According to PANews's investigation, the trading volume of Sui ecosystem tokens in Alpha is not large. The highest NAVX has a 24-hour trading volume of only 3.34 million US dollars, and the rest of HIPPO, BLUE, SCA and other trading volumes are even only between hundreds of thousands and tens of thousands of US dollars. In contrast, the trading volume of several projects on the Solana chain is basically above 10 million US dollars, and the trading volume of several head projects of BSC is as high as more than 200 million US dollars. However, for NAVX, the listing of Binance Alpha has indeed increased its trading volume. On May 13, the trading volume of the NAVX main pool reached 1.6 million US dollars, while the trading volume the day before was only a few thousand US dollars.

Binance Alpha points are intensifying, but the truth is not so good

In the actual transaction process, it can be found that the official cross-chain bridge of Binance Wallet has not yet opened up the exchange of assets on the Sui ecosystem and the BSC chain. Users cannot directly exchange assets such as BNB for USDC on Sui. If they want to save this wear and tear, they have to bear the wear and tear of other cross-chain bridges.

Solana head MEME unexpectedly receives capital inflow

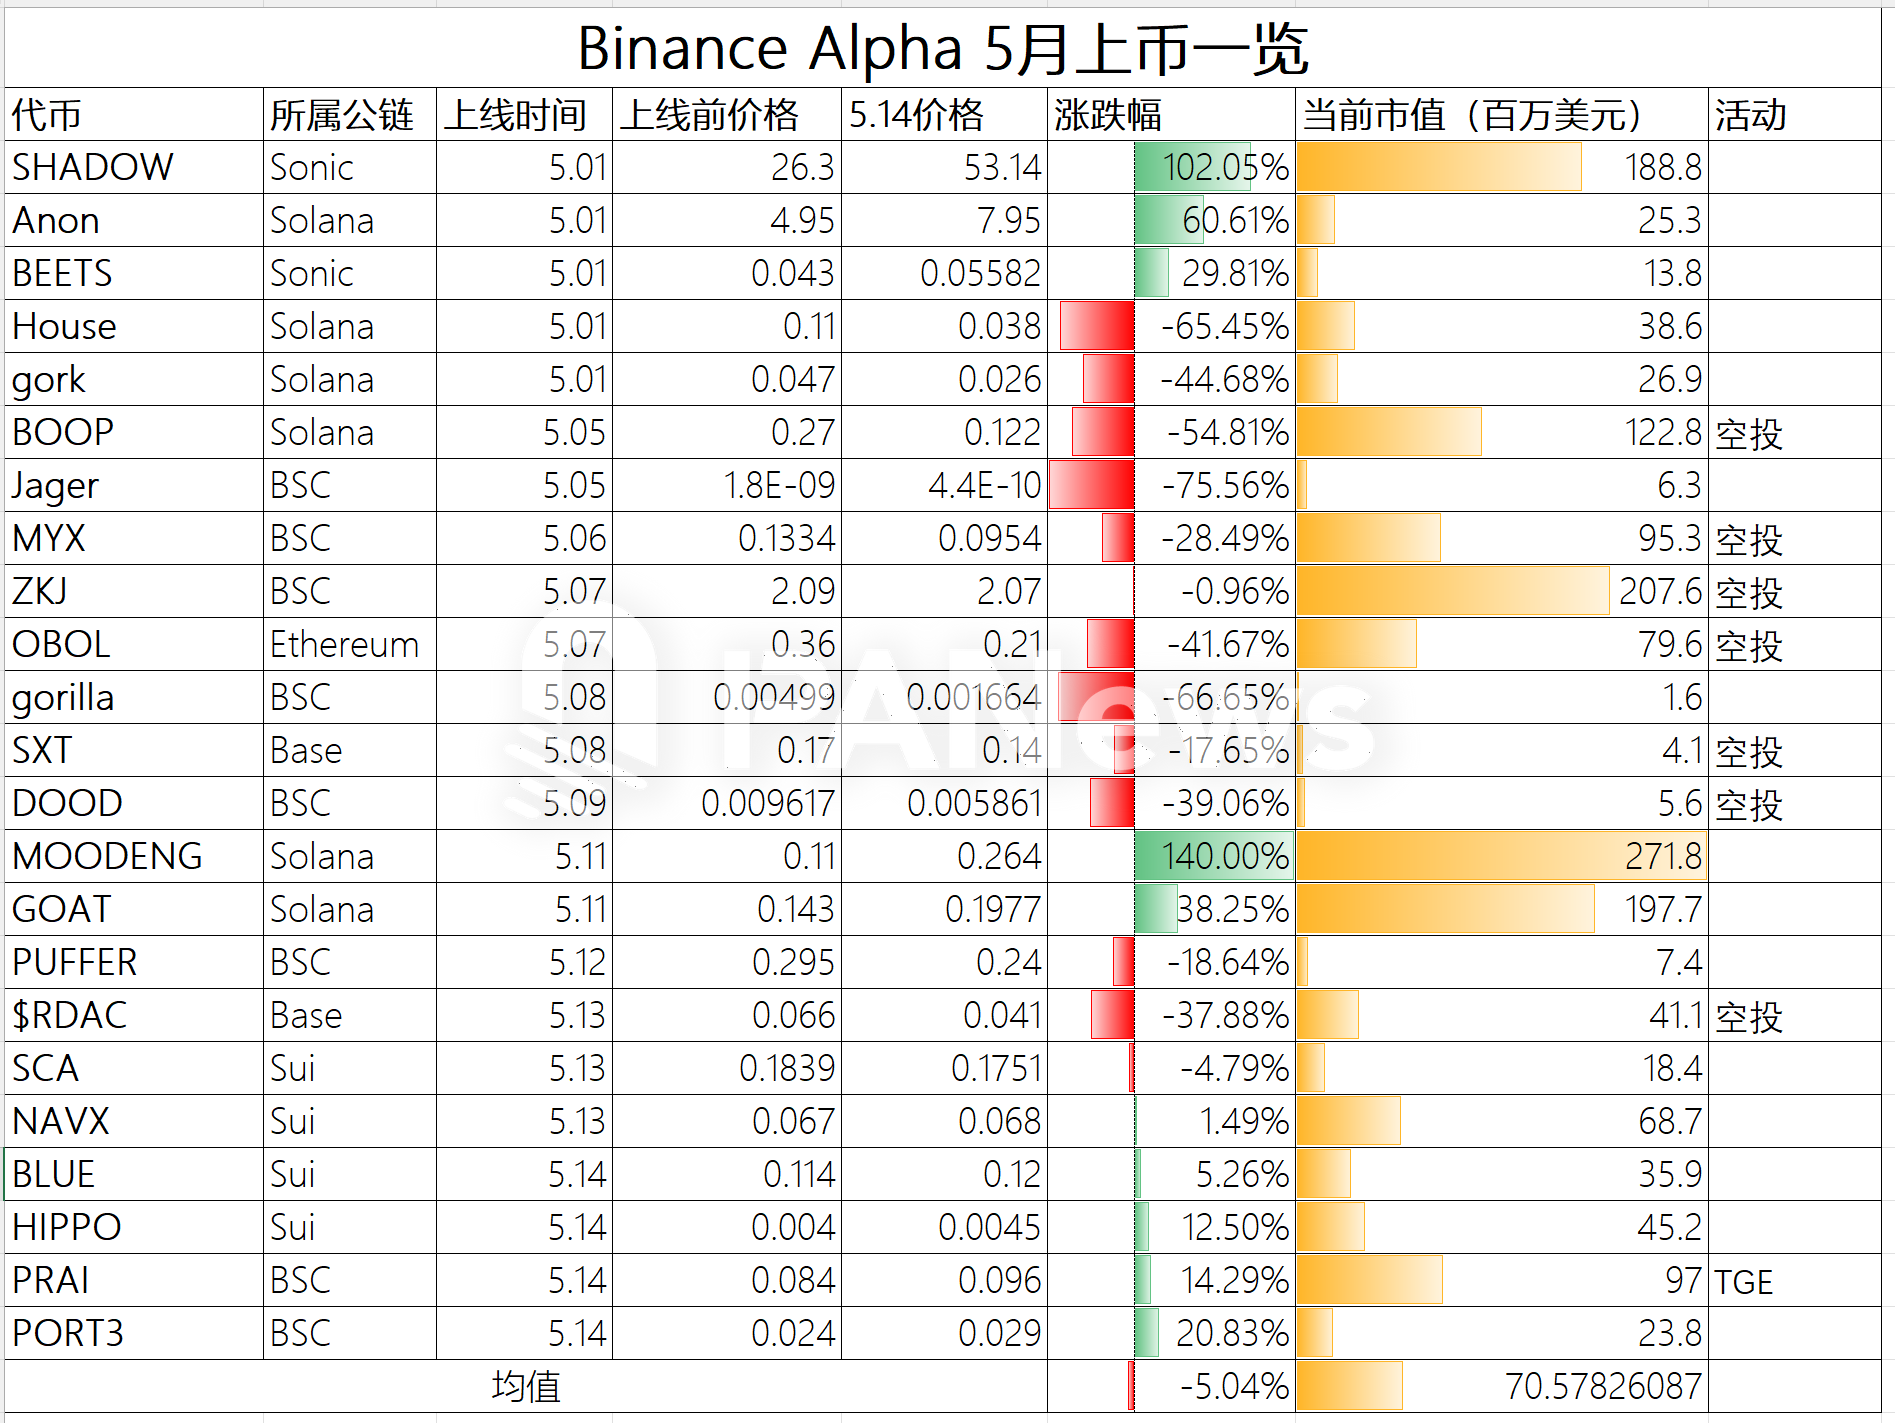
Solana is one of the ecosystems with the most projects launched on Binance Alpha besides BSC. Since May, Solana's overall DEX trading volume has indeed increased significantly. On May 4, Solana DEX's trading volume was US$2.2 billion. By May 15, this figure had increased to US$4.59 billion, more than doubling. Several leading tokens on Binance Alpha, such as MOODENG and jellyjelly, have indeed seen a huge increase in trading volume in recent times, and have also seen a significant increase. Among them, MOODENG's price rose by 140% from its launch to May 14. The average increase of the six tokens of the Solana ecosystem launched on Binance Alpha in May also reached 12.32%, making it one of the few ecosystems with positive performance among several public chains.

Binance Alpha points are intensifying, but the truth is not so good

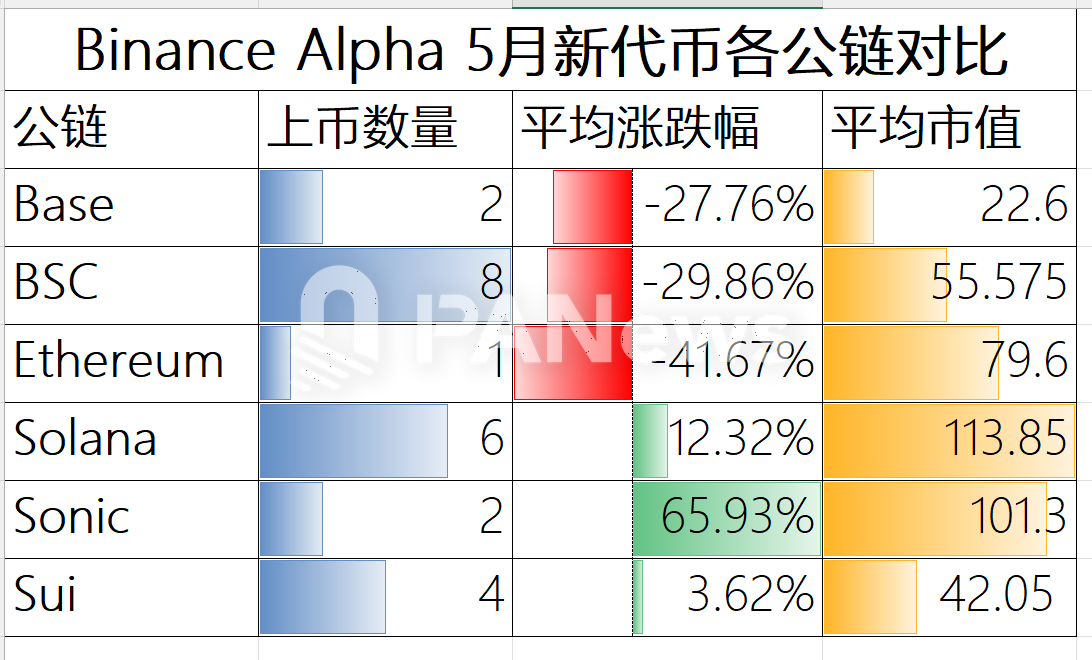
In addition to Sui and Solana ecosystems, the Sonic ecosystem may benefit the most from this spillover effect in the near future. As a new brand of Fantom, what Sonic needs most is exposure and capital inflow. Although there are only three Sonic ecosystem projects on Binance Alpha, in terms of price trends, the average increase of the two tokens launched in May reached 65.93% (data as of May 14), ranking the highest among all ecosystems. However, due to the small number of tokens launched, it cannot be said that the tokens of the Sonic ecosystem have higher potential. Binance Alpha points are intensifying, but the truth is not so good

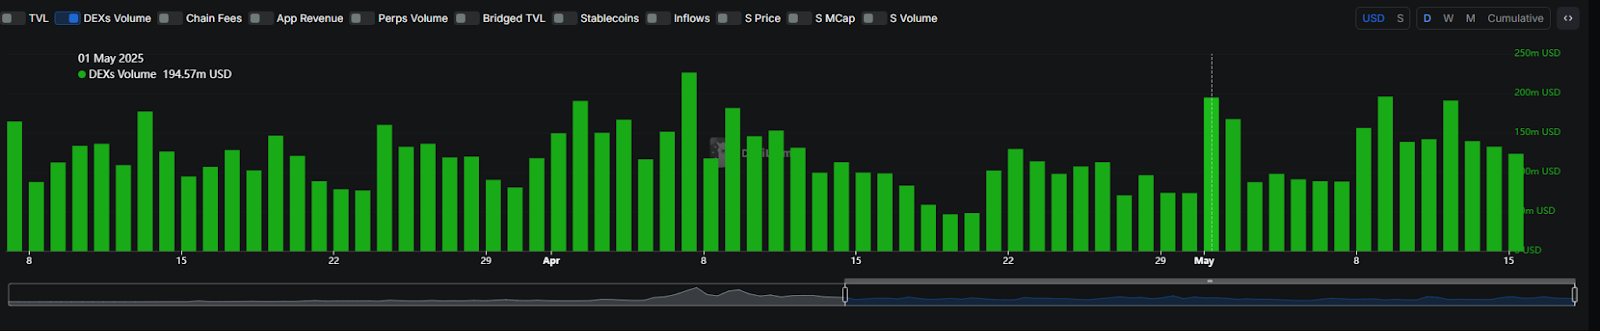
However, on May 1, when Binance Alpha announced the launch of two Sonic ecosystem projects, the DEX trading volume of Sonic ecosystem did see a significant increase, soaring from more than $73.4 million the previous day to $194 million.

Binance Alpha points are intensifying, but the truth is not so good

Project myth: Is launch the peak or value discovery?

In addition to the ecological perspective, for project developers, will the price of Binance Alpha have a chance to soar after it is launched? From a data perspective, the average increase or decrease of the 23 tokens launched in May was -5.04%. The largest decrease was 75%. Although the prices of these projects have experienced a rise in the short period of time after the launch of Binance Alpha, they will basically have a significant retracement and decline after the heat. From this point of view, the launch of Binance Alpha does not mean the birth of the Golden Dog, but just an additional trading port.

In addition, for the first-time projects with airdrop activities, it seems that they have not been favored by the market. The average decline of the 7 airdrop tokens launched in May reached 31.5%, and as of May 14, all of them were in a downward trend. From this point of view, for projects, airdrops and volume-washing activities cannot drive the price trend upward. Binance Alpha points are intensifying, but the truth is not so good

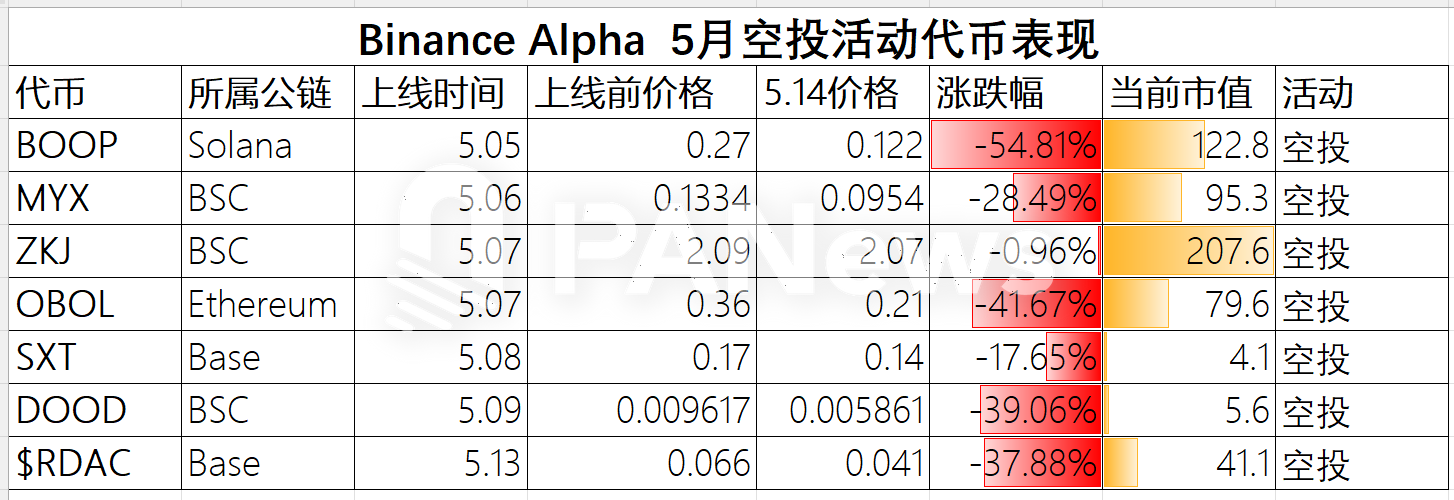
In general, the average market value of projects launched on Binance Alpha reached 70 million US dollars, with the lowest market value of about 1.6 million US dollars and the highest market value of MOODENG reaching 271 million US dollars. Among them, the average market value of several newly launched tokens in the Solana ecosystem exceeded 100 million US dollars, which obviously has higher requirements for the Solana ecosystem.

The end of "involution": the arena of professional players and the departure of ordinary users

For the ecosystem and projects, Binance Alpha means exposure and traffic gathering place. For users, the current internal circulation is eliminating ordinary users and becoming an arena for professional studios and big players to compete. With the score threshold reaching 205 points, it means that users need to complete at least 15 points of points every day to catch up with the threshold. According to the principal of 1,000 US dollars (accumulate 2 points), the daily transaction volume needs to reach 8,000 US dollars to complete the accumulation of points. The daily slippage + Gas fee of this transaction volume may reach more than 10 US dollars. If you fail to reach the next threshold or get less airdrops, you will face a double-sided loss of money and energy. The latest round of RDAC token airdrops basically sold for only 25 US dollars, which is difficult to cover the cost of 205 points.

It is foreseeable that the points threshold will continue to rise in the future. According to the current rules, the higher the points required per day, the more trading volume is required. Either Binance Alpha will increase the airdrop amount of a single address, or a large number of users will withdraw from the game, allowing the points threshold to fall back to a reasonable range. But in any case, this game of involution seems to be coming to an end. The DEX trading volume on the BSC chain has also begun to decline in recent days, reaching US$2.64 billion on May 15, a 16.4% decline from US$3.16 billion on May 12.

Overall, the "flow overflow" effect of Binance Alpha is significantly different in different ecosystems. The Sui ecosystem did not take on a large number of volume-brushing behaviors as expected, but the Solana ecosystem showed stronger positive interaction and growth. For project parties, the short-term highlights brought by Alpha are often difficult to transform into sustained value support. It has become normal for prices to fall after the peak after listing, and airdrop activities have not become the savior of prices. The project parties that provide airdrops have become the "payers" for Binance to promote wallet products.

The core problem is that this carnival driven by points is ruthlessly squeezing ordinary users out of the table. The rising point threshold and exponentially growing trading volume demand, coupled with the shrinking airdrop returns, have gradually transformed Binance Alpha into a "zero-sum game" between professional studios and large investors. The recent decline in DEX trading volume on the BSC chain seems to indicate that this model that relies on high-intensity "involution" is approaching the critical point of its sustainability.

Market Opportunity
SUI Logo
SUI Price(SUI)
$1,0786
$1,0786$1,0786
+0,20%
USD
SUI (SUI) Live Price Chart
Disclaimer: The articles reposted on this site are sourced from public platforms and are provided for informational purposes only. They do not necessarily reflect the views of MEXC. All rights remain with the original authors. If you believe any content infringes on third-party rights, please contact service@support.mexc.com for removal. MEXC makes no guarantees regarding the accuracy, completeness, or timeliness of the content and is not responsible for any actions taken based on the information provided. The content does not constitute financial, legal, or other professional advice, nor should it be considered a recommendation or endorsement by MEXC.

You May Also Like

Over 60% of crypto press releases linked to high-risk or scam projects: Report

Over 60% of crypto press releases linked to high-risk or scam projects: Report

A data analysis shows crypto press release wires are dominated by scam-linked projects, hype-driven content and low-impact announcements, raising concerns about
Share
Crypto.news2026/02/04 22:02
ArtGis Finance Partners with MetaXR to Expand its DeFi Offerings in the Metaverse

ArtGis Finance Partners with MetaXR to Expand its DeFi Offerings in the Metaverse

By using this collaboration, ArtGis utilizes MetaXR’s infrastructure to widen access to its assets and enable its customers to interact with the metaverse.
Share
Blockchainreporter2025/09/18 00:07
Crucial US Stock Market Update: What Wednesday’s Mixed Close Reveals

Crucial US Stock Market Update: What Wednesday’s Mixed Close Reveals

BitcoinWorld Crucial US Stock Market Update: What Wednesday’s Mixed Close Reveals The financial world often keeps us on our toes, and Wednesday was no exception. Investors watched closely as the US stock market concluded the day with a mixed performance across its major indexes. This snapshot offers a crucial glimpse into current investor sentiment and economic undercurrents, prompting many to ask: what exactly happened? Understanding the Latest US Stock Market Movements On Wednesday, the closing bell brought a varied picture for the US stock market. While some indexes celebrated gains, others registered slight declines, creating a truly mixed bag for investors. The Dow Jones Industrial Average showed resilience, climbing by a notable 0.57%. This positive movement suggests strength in some of the larger, more established companies. Conversely, the S&P 500, a broader benchmark often seen as a barometer for the overall market, experienced a modest dip of 0.1%. The technology-heavy Nasdaq Composite also saw a slight retreat, sliding by 0.33%. This particular index often reflects investor sentiment towards growth stocks and the tech sector. These divergent outcomes highlight the complex dynamics currently at play within the American economy. It’s not simply a matter of “up” or “down” for the entire US stock market; rather, it’s a nuanced landscape where different sectors and company types are responding to unique pressures and opportunities. Why Did the US Stock Market See Mixed Results? When the US stock market delivers a mixed performance, it often points to a tug-of-war between various economic factors. Several elements could have contributed to Wednesday’s varied closings. For instance, positive corporate earnings reports from certain industries might have bolstered the Dow. At the same time, concerns over inflation, interest rate policies by the Federal Reserve, or even global economic uncertainties could have pressured growth stocks, affecting the S&P 500 and Nasdaq. Key considerations often include: Economic Data: Recent reports on employment, manufacturing, or consumer spending can sway market sentiment. Corporate Announcements: Strong or weak earnings forecasts from influential companies can significantly impact their respective sectors. Interest Rate Expectations: The prospect of higher or lower interest rates directly influences borrowing costs for businesses and consumer spending, affecting future profitability. Geopolitical Events: Global tensions or trade policies can introduce uncertainty, causing investors to become more cautious. Understanding these underlying drivers is crucial for anyone trying to make sense of daily market fluctuations in the US stock market. Navigating Volatility in the US Stock Market A mixed close, while not a dramatic downturn, serves as a reminder that market volatility is a constant companion for investors. For those involved in the US stock market, particularly individuals managing their portfolios, these days underscore the importance of a well-thought-out strategy. It’s important not to react impulsively to daily movements. Instead, consider these actionable insights: Diversification: Spreading investments across different sectors and asset classes can help mitigate risk when one area underperforms. Long-Term Perspective: Focusing on long-term financial goals rather than short-term gains can help weather daily market swings. Stay Informed: Keeping abreast of economic news and company fundamentals provides context for market behavior. Consult Experts: Financial advisors can offer personalized guidance based on individual risk tolerance and objectives. Even small movements in major indexes can signal shifts that require attention, guiding future investment decisions within the dynamic US stock market. What’s Next for the US Stock Market? Looking ahead, investors will be keenly watching for further economic indicators and corporate announcements to gauge the direction of the US stock market. Upcoming inflation data, statements from the Federal Reserve, and quarterly earnings reports will likely provide more clarity. The interplay of these factors will continue to shape investor confidence and, consequently, the performance of the Dow, S&P 500, and Nasdaq. Remaining informed and adaptive will be key to understanding the market’s trajectory. Conclusion: Wednesday’s mixed close in the US stock market highlights the intricate balance of forces influencing financial markets. While the Dow showed strength, the S&P 500 and Nasdaq experienced slight declines, reflecting a nuanced economic landscape. This reminds us that understanding the ‘why’ behind these movements is as important as the movements themselves. As always, a thoughtful, informed approach remains the best strategy for navigating the complexities of the market. Frequently Asked Questions (FAQs) Q1: What does a “mixed close” mean for the US stock market? A1: A mixed close indicates that while some major stock indexes advanced, others declined. It suggests that different sectors or types of companies within the US stock market are experiencing varying influences, rather than a uniform market movement. Q2: Which major indexes were affected on Wednesday? A2: On Wednesday, the Dow Jones Industrial Average gained 0.57%, while the S&P 500 edged down 0.1%, and the Nasdaq Composite slid 0.33%, illustrating the mixed performance across the US stock market. Q3: What factors contribute to a mixed stock market performance? A3: Mixed performances in the US stock market can be influenced by various factors, including specific corporate earnings, economic data releases, shifts in interest rate expectations, and broader geopolitical events that affect different market segments uniquely. Q4: How should investors react to mixed market signals? A4: Investors are generally advised to maintain a long-term perspective, diversify their portfolios, stay informed about economic news, and avoid impulsive decisions. Consulting a financial advisor can also provide personalized guidance for navigating the US stock market. Q5: What indicators should investors watch for future US stock market trends? A5: Key indicators to watch include upcoming inflation reports, statements from the Federal Reserve regarding monetary policy, and quarterly corporate earnings reports. These will offer insights into the future direction of the US stock market. Did you find this analysis of the US stock market helpful? Share this article with your network on social media to help others understand the nuances of current financial trends! To learn more about the latest stock market trends, explore our article on key developments shaping the US stock market‘s future performance. This post Crucial US Stock Market Update: What Wednesday’s Mixed Close Reveals first appeared on BitcoinWorld.
Share
Coinstats2025/09/18 05:30