

Bitcoin Price Edges Down As Traders Brace For Bank Of Japan To Hike Interest Rates To 30-Year High
The Bitcoin price edged down a fraction of a percent in the past 24 hours to trade at $90,293 as of 11:11 a.m. EST on trading volume that dropped 28% to $50.8 billion.
BTC has been trading in a tight $91,000 zone as traders brace for the Bank of Japan (BoJ) to hike interest rates this week. Nikkei Asia reported that the BoJ will hike rates by 25 basis points to 0.75% on Dec. 19, the highest level in about 30 years.
That’s driving renewed concerns over the potential impact on risk assets worldwide.
The yield on Japan’s benchmark 10-year bond surged to 1.917% on Thursday, the highest since 2007, impacting investor sentiment across the globe.
In the past, the country’s low interest rates have acted as a base for cheap global liquidity, allowing funds to deploy capital into higher-risk assets such as equities and crypto.
Bitcoin Price In A Consolidation Phase, Holds Key Support
The BTC price has corrected after reaching an all-time high of $126,230, marked by a sequence of lower highs and increasing selling pressure on the 3-day timeframe.
The decline accelerated once the Bitcoin price lost the $105,000–$110,000 region, an area that previously acted as strong support around the 50-day Simple Moving Average (SMA).
The 50-day SMA (currently near $108,640) is now acting as the long-term resistance level, capping any upside attempts.
BTC eventually found demand in the $85,000 zone, which closely aligns with the 200-day SMA ($88,975), a key long-term trend indicator that often acts as a bull-market support level.
Following the selloff, Bitcoin has staged a recovery, pushing its price above the $90,000. However, the price of BTC now trades in a consolidation phase between $89,000 and $94,000.
Recent candles suggest selling pressure is easing, as downside momentum slows and BTC begins to stabilize above the recent swing low.
Meanwhile, the Relative Strength Index (RSI) is hovering around 36–37, remaining below the neutral 50 level, which indicates weak momentum.
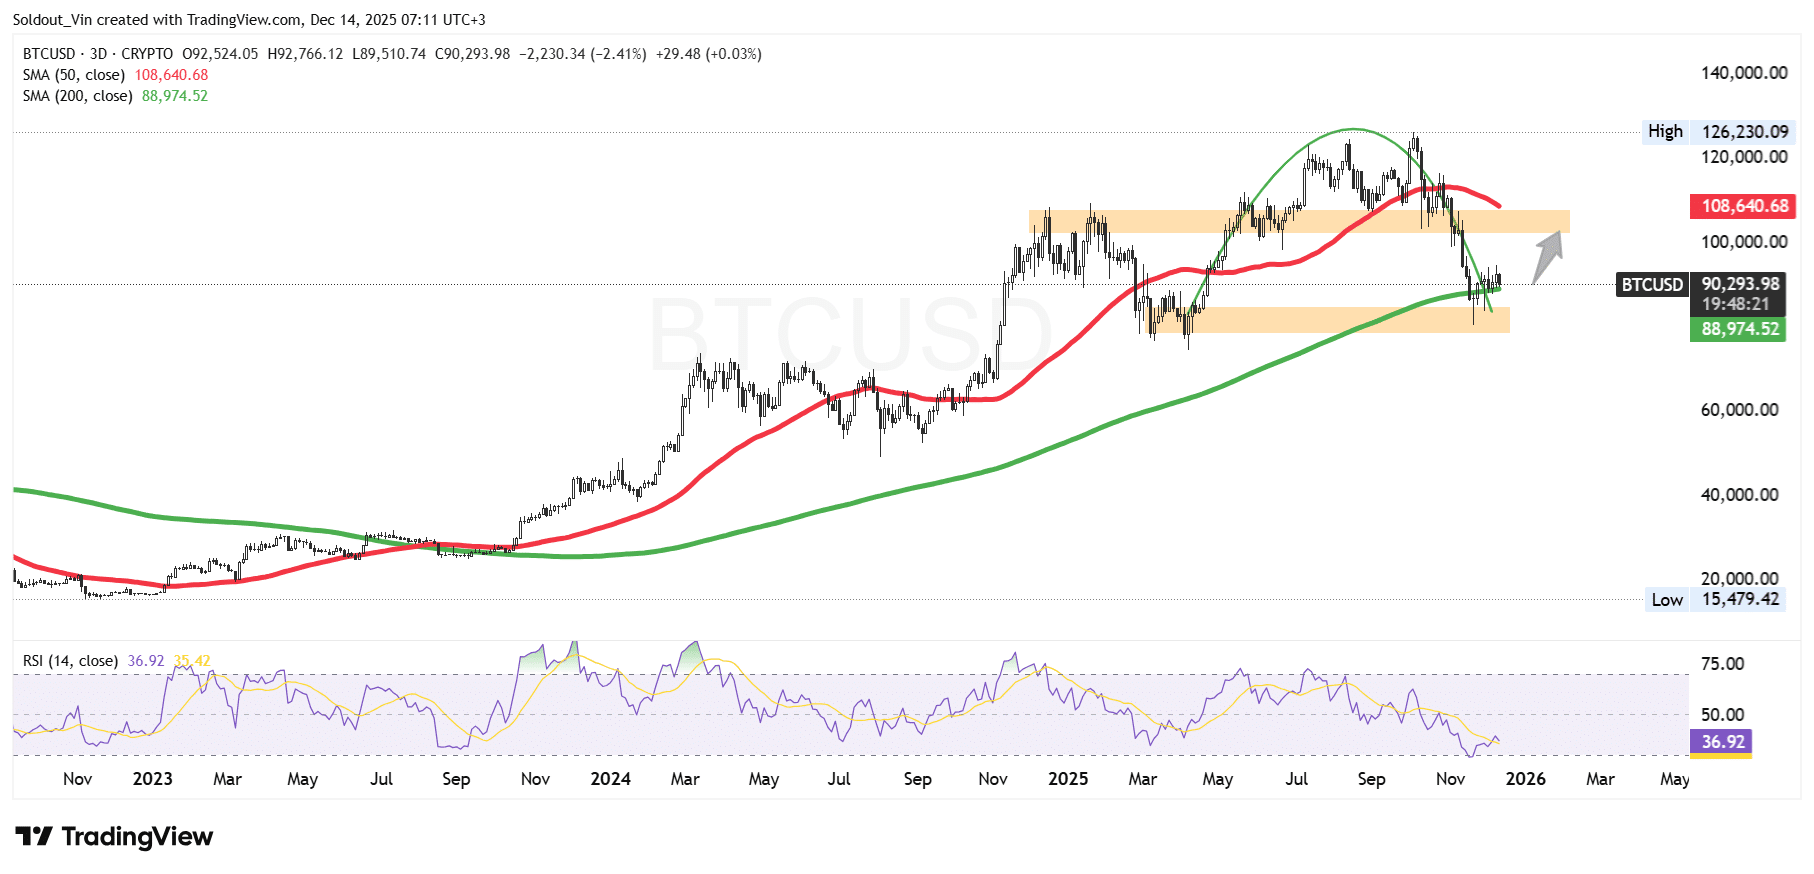 BTC/USD Chart Analysis Source: TradingView
BTC Price Prediction
According to the BTC/USD chart analysis, the BTC price appears to be consolidating above a major long-term support zone after a sharp corrective move from the $126,230 cycle high.
If Bitcoin manages to maintain support above the current demand zone and reclaim the $100,000 psychological level, the price could attempt a recovery toward the $105,000–$108,000 region, where the 50-period SMA and prior support-turned-resistance are located.
On the downside, if BTC fails to hold the $85,000 support zone and sellers regain control, the price could resume its corrective trend, with the next downside target sitting near the $75,000–$78,000 region.
Related News:
You May Also Like

XRP price weakens at critical level, raising risk of deeper pullback
Copy linkX (Twitter)LinkedInFacebookEmail

Wormhole Unveils W Token 2.0 with Enhanced Tokenomics
