As the market momentum fluctuates, it results in bringing in mixed signals across the crypto assets. Some are charted in green, and the majority of the tokens areAs the market momentum fluctuates, it results in bringing in mixed signals across the crypto assets. Some are charted in green, and the majority of the tokens are

Bulls Step In for MYX Finance (MYX): Will the 10% Rally Build Into a Bigger Run?

  • MYX Finance jumped 10%, reaching the $3.43 mark.
  • MYX’s daily trading volume skyrocketed by 155%.

As the market momentum fluctuates, it results in bringing in mixed signals across the crypto assets. Some are charted in green, and the majority of the tokens are in red. The largest asset, Bitcoin (BTC), trades at $89.4K, and the largest altcoin, Ethereum (ETH), hovers around $3.1K. 

Among the digital assets, MYX Finance (MYX) has moved counter to the prevailing trend. The asset opened the day trading at a bottom level of $3.00. With the bullish pressure gaining traction, the price has mounted to a high of $3.69, tested the key resistance zones between $3.06 and $3.63. 

Upon a 10.42% jump in value over the last 24 hours, the MYX Finance price is trading at around $3.43 at press time. The market cap of the asset is resting at $859.29 million. In addition, the daily trading volume of MYX has skyrocketed by over 115.27%, reaching the $89.48 million mark. 

Is MYX Finance Gearing Up for Another Price Leg Higher?

MYX Finance’s Moving Average Convergence Divergence line has moved above the signal line, which indicates a growing bullish trend. If the MACD continues to diverge above the signal line, it likely backs further upside. Besides, the Chaikin Money Flow indicator at 0.16 suggests positive money flow into the MYX market, reflecting steady buying interest. In case CMF remains above zero or rises further, it supports the bullish bias.

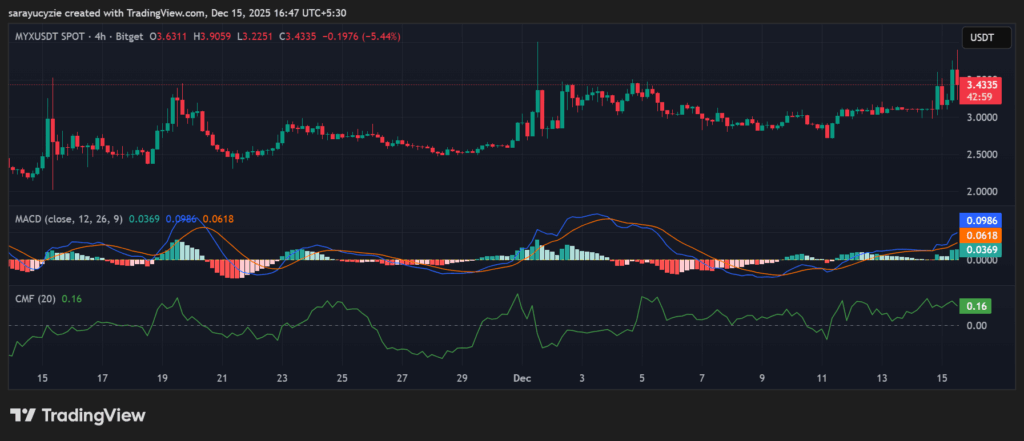
MYX chart (Source: TradingView)

The 24-hour Relative Strength Index (RSI) value of 61.92 points to moderate bullish momentum. The buying pressure is stronger than the selling pressure, but MYX is not yet overbought. A rise toward 70 increases the bullish strength. MYX Finance’s Bull Bear Power (BBP) reading of 0.6062 signals that the bulls are in control, reflecting improving market strength. Further bullish pressure reinforces the active trend.

Zooming in on the trading chart of MYX Finance, it exhibits a potential uptrend. As the green candles are lit up, the price might ascend to its crucial resistance at $3.55. A break above this range could trigger the bulls to hit above $3.68. On the flip side, assuming the bearish shift, the MYX Finance price could slip immediately toward $3.31. An extended correction on the downside might push the price even lower to the $3.17 level.

Top Updated Crypto News

XRP Price Standoff: Shake-Up Incoming, or Does the Sideways Struggle Continue?

Market Opportunity
BULLS Logo
BULLS Price(BULLS)
$301.87
$301.87$301.87
-0.01%
USD
BULLS (BULLS) Live Price Chart
Disclaimer: The articles reposted on this site are sourced from public platforms and are provided for informational purposes only. They do not necessarily reflect the views of MEXC. All rights remain with the original authors. If you believe any content infringes on third-party rights, please contact service@support.mexc.com for removal. MEXC makes no guarantees regarding the accuracy, completeness, or timeliness of the content and is not responsible for any actions taken based on the information provided. The content does not constitute financial, legal, or other professional advice, nor should it be considered a recommendation or endorsement by MEXC.

You May Also Like

Trump Cancels Tech, AI Trade Negotiations With The UK

Trump Cancels Tech, AI Trade Negotiations With The UK

The US pauses a $41B UK tech and AI deal as trade talks stall, with disputes over food standards, market access, and rules abroad.   The US has frozen a major tech
Share
LiveBitcoinNews2025/12/17 01:00
Egrag Crypto: XRP Could be Around $6 or $7 by Mid-November Based on this Analysis

Egrag Crypto: XRP Could be Around $6 or $7 by Mid-November Based on this Analysis

Egrag Crypto forecasts XRP reaching $6 to $7 by November. Fractal pattern analysis suggests a significant XRP price surge soon. XRP poised for potential growth based on historical price patterns. The cryptocurrency community is abuzz after renowned analyst Egrag Crypto shared an analysis suggesting that XRP could reach $6 to $7 by mid-November. This prediction is based on the study of a fractal pattern observed in XRP’s past price movements, which the analyst believes is likely to repeat itself in the coming months. According to Egrag Crypto, the analysis hinges on fractal patterns, which are used in technical analysis to identify recurring market behavior. Using the past price charts of XRP, the expert has found a certain fractal that looks similar to the existing market structure. The trend indicates that XRP will soon experience a great increase in price, and the asset will probably reach the $6 or $7 range in mid-November. The chart shared by Egrag Crypto points to a rising trend line with several Fibonacci levels pointing to key support and resistance zones. This technical structure, along with the fractal pattern, is the foundation of the price forecast. As XRP continues to follow the predicted trajectory, the analyst sees a strong possibility of it reaching new highs, especially if the fractal behaves as expected. Also Read: Why XRP Price Remains Stagnant Despite Fed Rate Cut #XRP – A Potential Similar Set-Up! I've been analyzing the yellow fractal from a previous setup and trying to fit it into various formations. Based on the fractal formation analysis, it suggests that by mid-November, #XRP could be around $6 to $7! Fractals can indeed be… pic.twitter.com/HmIlK77Lrr — EGRAG CRYPTO (@egragcrypto) September 18, 2025 Fractal Analysis: The Key to XRP’s Potential Surge Fractals are a popular tool for market analysis, as they can reveal trends and potential price movements by identifying patterns in historical data. Egrag Crypto’s focus on a yellow fractal pattern in XRP’s price charts is central to the current forecast. Having contrasted the market scenario at the current period and how it was at an earlier time, the analyst has indicated that XRP might revert to the same price scenario that occurred at a later cycle in the past. Egrag Crypto’s forecast of $6 to $7 is based not just on the fractal pattern but also on broader market trends and technical indicators. The Fibonacci retracements and extensions will also give more insight into the price levels that are likely to be experienced in the coming few weeks. With mid-November in sight, XRP investors and traders will be keeping a close eye on the market to see if Egrag Crypto’s analysis is true. If the price targets are reached, XRP could experience one of its most significant rallies in recent history. Also Read: Top Investor Issues Advance Warning to XRP Holders – Beware of this Risk The post Egrag Crypto: XRP Could be Around $6 or $7 by Mid-November Based on this Analysis appeared first on 36Crypto.
Share
Coinstats2025/09/18 18:36
Truoux: In the Institutionalized Crypto Markets, How Investors Can Strengthen Anti-Scam Awareness

Truoux: In the Institutionalized Crypto Markets, How Investors Can Strengthen Anti-Scam Awareness

As the crypto market draws increasing attention from institutions, investors must remain vigilant, guard against various scam tactics, and rationally choose compliant
Share
Techbullion2025/12/17 01:31