Bitcoin supply guide: When holders sell, miners strain, and ETFs add pressure
Bitcoin supply guide: cost-basis bands, miner stress, and ETF flow signals
Bitcoin is currently trading outside a $93,000–$110,000 cost-basis band that Glassnode frames as an “overhead supply” zone.
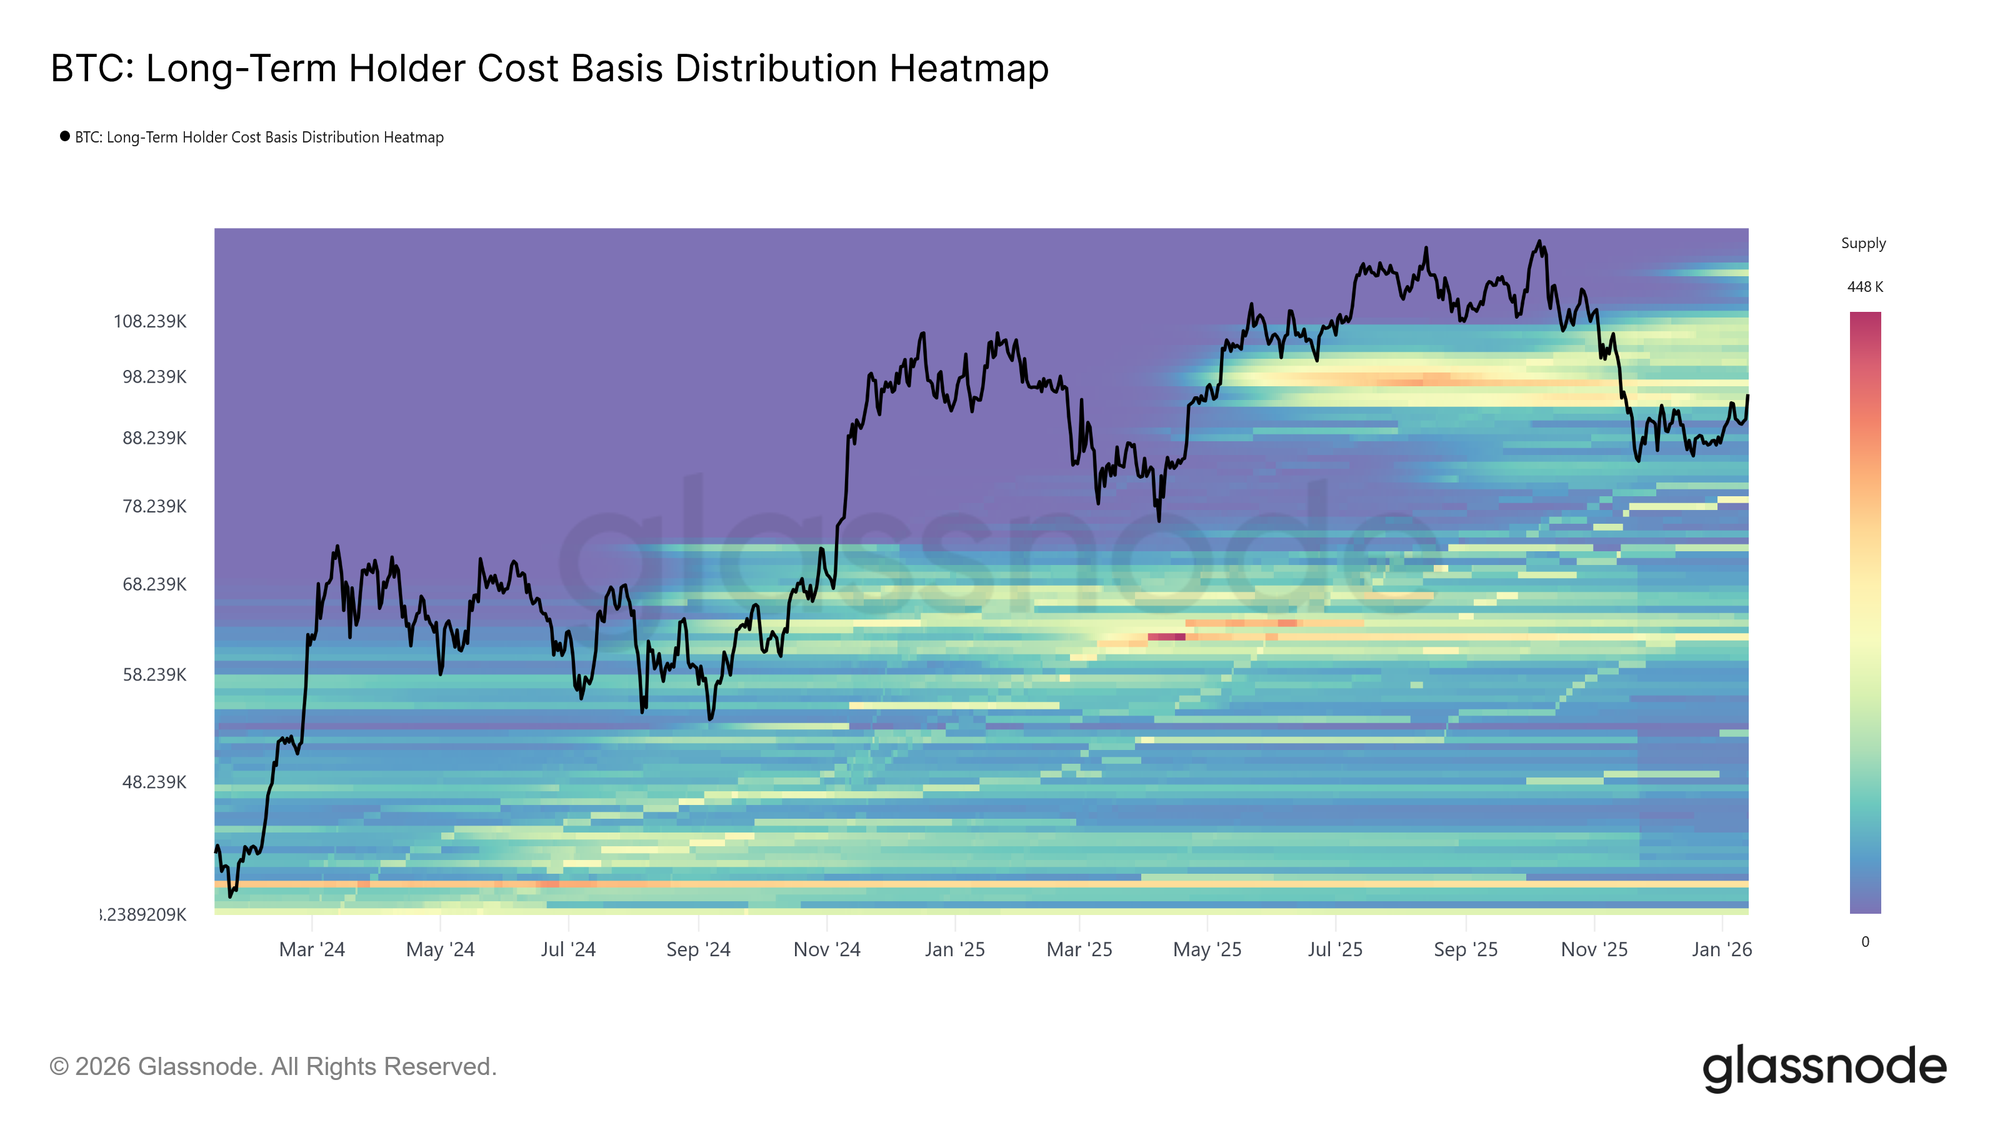 BTC long term holder cost basis distribution heatmap (Source: Glassnode)
That setup puts the next quarter’s supply story on miner cash flow and holder behavior rather than the issuance schedule. According to Glassnode’s Week On-chain W02 2026, the Short-Term Holder (STH) cost basis sits near $98,300.
That level often becomes a reference point for whether recent buyers add exposure or distribute into rebounds.
At the same time, mining markets are pricing a lean profitability regime.
The Hashrate Index roundup dated Jan. 26, 2026 put the six-month hashprice forward curve at about $33.25 per PH/s per day (about 0.00041 BTC), below the zone it has described as breakeven for many miners ($39.50) depending on operating costs and machine types.
Related CryptoSlate context: miner-stress narratives often hinge on the same profitability/difficulty loop described in Bitcoin’s hashrate continues to fall as the price spike doesn’t convince miners to turn machines back on.
This quarter’s additional variable is whether ETF flows act as a sink for tradable supply or a release valve.
SoSoValue data recorded $681 million in net outflows from spot Bitcoin ETFs in the first full trading week of 2026, in a risk-off setup tied to rate expectations and macro headlines. Last week, net flows reached -$1.3 billion, the worst week since May 2025.
For additional CryptoSlate reporting context on that same early-2026 flow regime, see Bitcoin breaking $126,000 has clear 3 year pathway but a brutal $1.3 billion exodus changes everything today.
Key takeaways
- Bitcoin’s issuance schedule is fixed by the protocol, with a 21 million cap and reward halvings every 210,000 blocks. Near-term “supply shocks” tend to come from tradable float and incentives, according to Blockchain.com’s supply chart.
- Glassnode places current overhead supply between $93,000 and $110,000, with the STH cost basis around $98,300. That range becomes a demand-absorption test for the quarter, according to Glassnode W02 2026.
- Hashrate and difficulty already adjusted to stress, with the 7-day SMA hashrate moving from 1,003 EH/s to 966 EH/s and difficulty falling 3.28% to 141.67T on Jan. 22, according to Hashrate Index (Jan. 26, 2026). For background, see Bitcoin hashrate hits new high of 943 EH/s as difficulty adjusted down 0.45%.
- Mining forwards implying roughly $39.50/PH/s/day over six months keeps attention on miner treasury management and shutdown risk. “Breakeven” depends on opex and fleet efficiency, according to Hashrate Index.
- ETF flow direction remains a swing factor after such a terrible month to start the year, with $1 billion in net outflows.
Who this is for
- Long-term allocators tracking cohort supply, cost-basis bands, and maturation dynamics
- Swing traders focused on the STH cost basis and overhead supply reactions
- Institutional desks monitoring ETF flow regimes and miner-driven liquidity
- Mining and infra operators managing hashprice exposure and difficulty timing
What to watch this quarter
- Price behavior around the STH cost basis near $98,300 and regaining its place inside the $93,000–$110,000 overhead band (Glassnode W02 2026)
- Six-month hashprice expectations recovering to near $39.50/PH/s/day and spot hashprice divergence from the curve (Hashrate Index)
- Difficulty adjustment cadence following the Jan. 22, 3.28% drop to 141.67T (Hashrate Index).
- Venue flow mix, including Glassnode’s note that Binance and aggregate exchange flows shifted into buy-dominant regimes while Coinbase sell pressure eased (Glassnode W02 2026)
- Weekly spot Bitcoin ETF net flows after $1.3 billion outflows last week.
Issuance basics + halving (what is fixed vs what is variable)
Bitcoin’s total supply path is deterministic at the protocol layer, with a maximum of 21 million BTC and block-subsidy halvings every 210,000 blocks.
That constraint matters for long-horizon valuation and for quarter-to-quarter issuance math. New supply enters on a schedule the market can model.
The more immediate question for the next quarter is market-available supply.
That means the inventory that can reach spot venues through miner sales, holder distribution, and ETF creations or redemptions. This is where “supply shocks” often form, since the issuance curve is known while liquidity decisions are conditional.
Most quarter-scale volatility maps to the second.
Miner economics & sell pressure (why hashprice is the live supply lever)
Mining acts as an elastic supply lever because miner BTC sales are one of the few structural sources of recurring distribution.
That elasticity was visible in late January. Hashrate Index reported the 7-day SMA hashrate fell from 1,003 EH/s to 966 EH/s, and network difficulty adjusted down 3.28% to 141.67T on Jan. 22.
Forward markets also imply constrained miner margins.
The same roundup reported the hashprice forward curve pricing an average of about $33.25 per PH/s per day over the next six months. Hashrate Index has separately described $39–$40/PH/s/day as near breakeven for many miners, while stressing it varies by operating costs and machine model.
A forward-looking frame for this quarter uses three conditional paths grounded in those data points:
- Near-breakeven grind: If hashprice recovers near the forward-implied ~$33.25/PH/s/day, higher-cost fleets face tighter treasury conditions.
- That can translate into periodic hashrate dips and episodic spot selling to fund operations, according to Hashrate Index.
- Difficulty-driven relief: If hashrate weakens further, subsequent difficulty reductions can lift revenue per unit hash even with flat BTC price.
- That reduces forced selling at the margin, as the Jan. 22 adjustment illustrates.
- Macro-driven compression: If a broader risk-off move pressures BTC price while hashprice sits near breakeven, shutdowns can accelerate.
- That feeds the same difficulty-relief loop with uncertain timing.
Miner balance sheet policy can shift realized sell pressure within a quarter.
Related CryptoSlate miner-stress framing: Bitcoin faces potential miner capitulation as hash rate continues to drop.
Long-term vs short-term holders (where overhead supply actually comes from)
Glassnode’s current map frames the supply overhang as a cost-basis band rather than a single price.
In Week On-chain W02 2026, it described the market as testing supply spanning approximately $93,000–$110,000, while placing the STH cost basis at $98,300.
For this quarter, that framing matters because it defines where prior buyers may use rallies to exit.
It also defines where new demand must absorb inventory to avoid renewed distribution.
Holder behavior has softened versus late 2025 without flipping into accumulation.
Glassnode said Long-Term Holder (LTH) supply continues to trend lower, while the rate of decline slowed materially compared with the distribution seen throughout Q3 and Q4 2025. It also put LTH net realized profit near 12.8k BTC per week, down from cycle peaks above 100k BTC per week.
The regime-change condition Glassnode identifies for a more durable rally is a shift where maturation supply outpaces LTH spending.
That would push LTH supply higher. In quarter terms, the overhead band can clear only if selling pressure decelerates faster than new and returning demand.
One technical caveat matters when readers compare dashboards.
Glassnode’s supply endpoints do not treat 155 days as a hard cutoff. Its cohorts use a logistic weighting centered at 155 days with a 10-day transition width.
Common myths (supply narratives that fail under measurement)
- Myth: The halving creates immediate scarcity in tradable supply. Issuance changes are block-based and known, while quarter-scale supply pressure is often driven by miner profitability and holder distribution decisions.
- Myth: 155 days is a strict boundary for LTH classification. Glassnode’s supply cohorts use a logistic weighting centered at 155 days with a 10-day transition width, which affects interpretation near inflection points.
- Myth: Miner capitulation is a single event. The hashrate and difficulty system can ratchet down and then normalize profitability per unit hash, as seen in the Jan. 22 difficulty reduction following a hashrate decline.
Metrics dashboard (the minimum set to monitor for the next 6 months)
| Area | Metric | Current reference from sources | Why it matters this quarter | Source |
|---|---|---|---|---|
| Protocol | Supply cap and halving cadence | 21M max supply, halving every 210,000 blocks | Anchors issuance math, shifts focus to tradable float | Blockchain.com |
| Mining | Hashrate (7-day SMA) | 1,003 EH/s to 966 EH/s (late Jan. 2026) | Shutdown risk and miner revenue stress proxy | Hashrate Index (Jan. 26, 2026) |
| Mining | Difficulty adjustments | -3.28% to 141.67T on Jan. 22, 2026 | Mechanical relief valve for miner margins | Hashrate Index (Jan. 26, 2026) |
| Mining | Hashprice forward curve (6 months) | ~$33.25/PH/s/day | Frames treasury pressure and forced-sell probability | Hashrate Index (Feb. 3, 2026) |
| Holders | Overhead supply band | ~$93k to $110k | Defines where prior cost basis can convert rallies into sell flow | Glassnode W02 2026 |
| Holders | STH cost basis | ~$98.3k | Confidence threshold for recent buyers near overhead supply | Glassnode W02 2026 |
| Holders | LTH distribution pacing | ~12.8k BTC per week net realized profit, slower than prior peaks | Tracks whether distribution is fading or resuming into strength | Glassnode W02 2026 |
| Liquidity | Venue flow dominance | Binance and aggregate flows buy-dominant, Coinbase sell pressure eased | Absorption capacity at overhead supply depends on routing | Glassnode W02 2026 |
| ETFs | Weekly net flows | -$1B in first month of 2026 | Net outflows can return inventory to the market via redemptions | SoSoValue via reporting |
Red flags & invalidation
- Any claim that exchange balances are “down X% recently” without a current-dated dataset should be treated as invalid.
- “Breakeven hashprice” should remain conditional on opex and hardware, since Hashrate Index frames $39–$40/PH/s/day as near breakeven for many miners depending on those inputs.
Action checklist, monitoring routine
- Weekly: Record ETF net flow sign and magnitude after the -$681 million outflow week, using SoSoValue-linked reporting for comparability.
- Each difficulty epoch: Track whether difficulty continues to fall after Jan. 22’s 3.28% reduction, and compare with hashrate direction for miner stress context.
- Daily/rolling: Compare spot hashprice to the six-month forward average near $33.25/PH/s/day to gauge whether miners face tightening or relief.
- Regime check: Track whether LTH supply remains net declining or turns up under Glassnode’s “maturation exceeds spending” condition.
- Price context: Observe market reactions around $98,300 and within $93,000–$110,000, since those levels map to STH and overhead supply cost basis in the current Glassnode framing.
Those inputs should be tied back to the fixed Bitcoin issuance schedule.
The post Bitcoin supply guide: When holders sell, miners strain, and ETFs add pressure appeared first on CryptoSlate.
You May Also Like

Ethereum unveils roadmap focusing on scaling, interoperability, and security at Japan Dev Conference

Here’s How Consumers May Benefit From Lower Interest Rates