

BNB price slips below $620 golden pocket, now testing long-term support near $609
BNB price is now trading around $609, slipping below the previously defended $620 golden pocket level and putting long-term support to the test.
- Price dips under the $620 0.618 Fibonacci “golden pocket”
- Trading near the 200-week moving average, a key macro support
- Structure remains intact — but bulls need a reclaim of $620
Binance (BNB) is once again at a critical inflection point after losing the $620 region that had been acting as a high-timeframe support cluster. Following weeks of corrective pressure, price briefly stabilized at the 0.618 Fibonacci retracement before slipping modestly lower, now hovering near $609.
This move shifts the technical narrative slightly: rather than cleanly holding support, BNB is now probing the lower bounds of a major confluence zone. Whether this becomes a deviation below support or the start of deeper consolidation will likely define the next multi-week trend.
BNB price key technical points
- $620 remains the high-timeframe golden pocket (0.618 Fibonacci retracement)
- Price is hovering around the 200-week moving average
- A reclaim of $620 would strengthen the bullish case
- Sustained acceptance below opens the door to further downside exploration
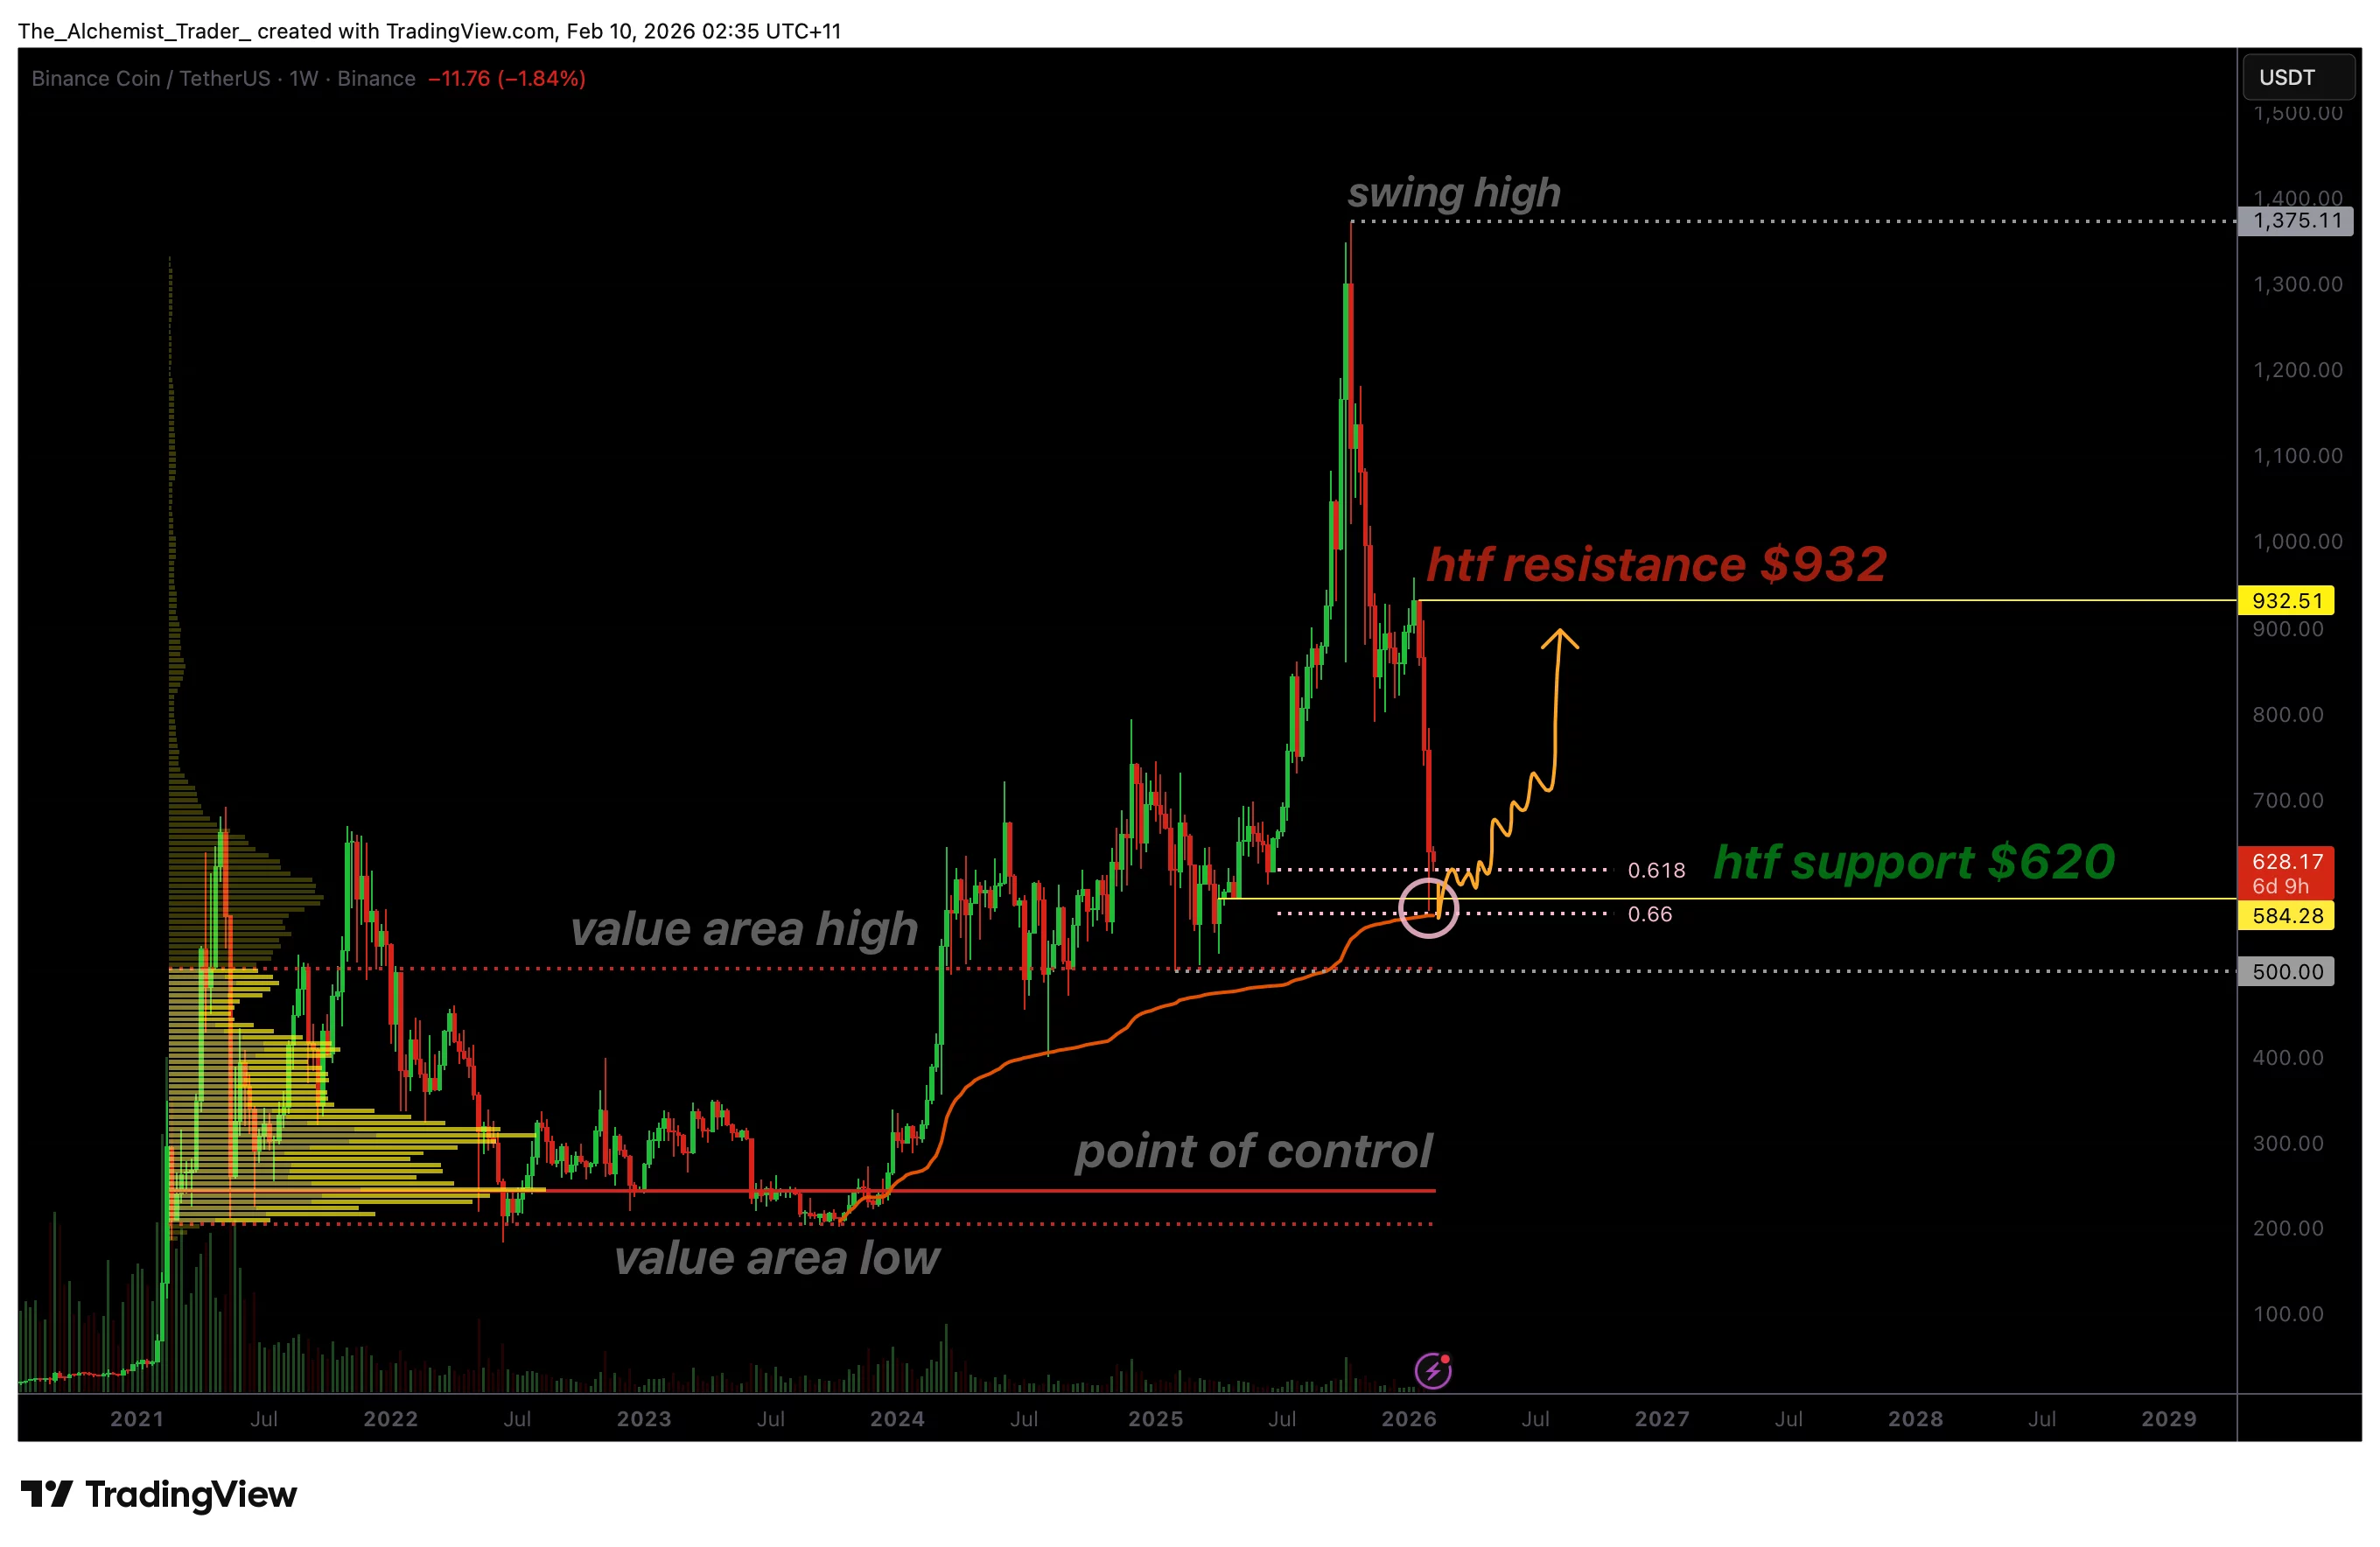
The $620 level continues to carry heavy technical weight. It marks the 0.618 Fibonacci retracement of the broader advance — often referred to as the “golden pocket,” a zone that frequently acts as a high-probability reversal area.
However, with BNB now trading below that level, the focus shifts to whether this is a temporary liquidity sweep or a more meaningful breakdown.
Importantly, price remains near the 200-week moving average — a widely followed macro trend indicator. Historically, sustained closes below this level tend to invite extended consolidation, while swift recoveries often signal a false breakdown.
The next few weekly closes will therefore be critical.
Market structure supports a potential bottom
From a broader market structure perspective, the chart has not yet confirmed a full trend reversal. While the loss of $620 weakens the immediate bullish structure, BNB has not decisively broken down into lower macro territory.
This type of price action — slipping below support before reclaiming it — is common during bottoming formations. Markets often sweep liquidity below obvious levels before rotating higher.
If buyers step in and push price back above $620 with conviction and expanding volume, the move could be classified as a deviation, reinforcing the broader bullish structure.
If not, deeper consolidation becomes increasingly likely.
Upside targets come back into focus
Bullish case:
- Reclaim and hold above $620
- Strong weekly close back inside the golden pocket
- Gradual rotation toward higher resistance
- $932 remains the key high-timeframe resistance target
Bearish case:
- Continued weekly closes below $620
- Loss of the 200-week moving average
- Expansion in selling volume
- Potential move toward lower value areas before base formation
What to expect in the coming price action
The $932 high-timeframe resistance remains the primary upside objective if macro structure holds. However, reclaiming $620 is the first major hurdle bulls must clear before that target comes back into play.
With BNB now around $609, this is no longer simply a stabilization story — it is a support test.
High-timeframe setups require patience. The coming weekly closes will determine whether the current move becomes a confirmed breakdown or a classic deviation below major support.
For now, the broader structure is under pressure but not broken. A decisive reclaim of $620 would quickly restore bullish momentum. Failure to do so would shift focus toward extended consolidation before any meaningful upside rotation can begin.
You May Also Like

BlueDot Meetings Enters the Video Meeting Market with Focus on Security and Seamless AI-Powered Language Translation, taking on Zoom and Microsoft Teams

USDC Treasury mints 250 million new USDC on Solana
