Litecoin (LTC) Prints Rare Bullish Structure That Previously Led to Massive Rallies
Patterns sometimes help explain what could unfold for a crypto asset over time. Technical analysis offers one of the clearest ways to judge whether a rebound may appear, even though price structure alone cannot replace fundamental insight. Litecoin now sits near a zone where history shows rebounds often begin, especially if broader market conditions improve.
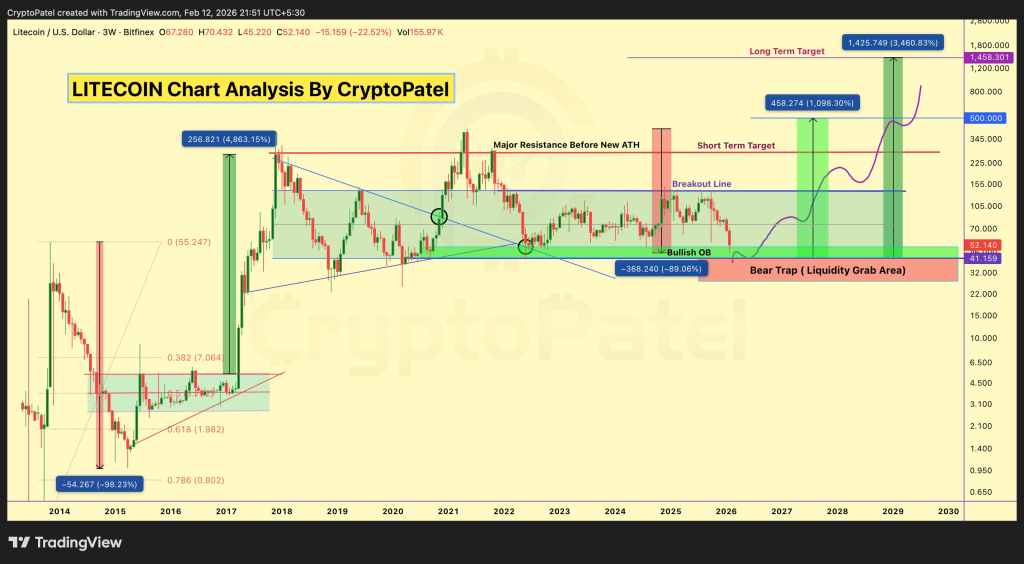
A recent chart study shared by Crypto Patel places Litecoin price at a decisive macro location after an almost 89% decline from its previous cycle peak.
Deep drawdowns of this size have appeared before major recovery phases in earlier Litecoin cycles. That context creates interest around the current structure because similar resets in 2015 and again before 2017 led to powerful upside expansions.
Crypto Patel identifies a liquidity grab between roughly $42 and $32, an area where price briefly moved lower before stabilizing. Such behavior often clears weaker positions and prepares the ground for accumulation near high timeframe support. The chart also highlights a bullish order block between about $41 and $51. This region forms a demand zone where buyers historically defend value.
 @CryptoPatel / X
Price stability above $40 remains central to the broader thesis. A sustained move below that level would weaken the constructive outlook and reopen downside risk. Holding above support keeps the macro structure intact and preserves the possibility of a gradual recovery path.
Historical comparison strengthens this view. Litecoin experienced a near 98% reset during the 2014 to 2015 bear market, followed by an expansion of more than 800% from the bottom.
Another compression phase later produced a multi-year rally that carried price dramatically higher into the 2017 cycle. Repetition never guarantees outcome, yet recurring behavior across cycles gives analysts a useful framework for probability.
Breakout Confirmation Above Key Resistance Could Define Next LTC Expansion Phase
The chart shared by Crypto Patel marks $140 as the decisive breakout level that would confirm a transition from accumulation into expansion. Resistance also appears near $82, $140, and $270, each representing former structural barriers where price previously struggled to advance. Movement through these zones would signal strengthening trend conditions on higher timeframes.
Upside projections extend toward $100, then $300, followed by $500 and potentially higher territory if a full cycle expansion unfolds. Those targets mirror the scale of earlier Litecoin rallies after deep bear market resets. Distance between the present accumulation zone and the highest projection illustrates the asymmetric structure that long horizon participants often monitor.
Read Also: Avalanche (AVAX) Just Flashed a Rare Reversal Signal Following Its 95% Crash
Independent observation of the chart supports the idea of compression near support after a prolonged decline. Volatility contraction near demand zones frequently precedes wider price movement once confirmation appears. Confirmation still depends on strength above resistance and continued defense of macro support, which means patience remains essential.
Litecoin therefore stands at a technically meaningful crossroads shaped by history, structure, and market timing. Crypto Patel frames the current zone as a rare confluence where liquidity sweep, bullish order block, and long term support align in one region. Future direction will depend on whether resistance eventually gives way and broader crypto conditions remain constructive.
Subscribe to our YouTube channel for daily crypto updates, market insights, and expert analysis.
The post Litecoin (LTC) Prints Rare Bullish Structure That Previously Led to Massive Rallies appeared first on CaptainAltcoin.
You May Also Like

WLFI Expands Into Forex With World Swap Launch

Usdt stablecoin could challenge Bitcoin leadership