

Mantle (MNT) Holds $0.60 Support While Triangle Pattern Signals Volatility Ahead
Mantle (MNT) continued its weakness during its defined consolidation phase. The price movement of the token has been characterized by an overall bearish sentiment in the crypto market. The latest analysis of Mantle’s price has indicated that the token has reached an inflection point.
At the time of writing, Mantle (MNT) is trading at $0.6118 with a 24-hour volume of $44 million and a market capitalization of $2 billion, based on CoinMarketCap data. The price has decreased by 1.72% over the last 24 hours, maintaining its decline over the short term.
Mantle Compression Hints Major Move
Crypto analyst Alpha Crypto Signal provided a lower-timeframe chart analysis of MNT on X on February 13, 2026. In this analysis, Alpha Crypto Signal identified that MNT is consolidating inside a symmetrical triangle after a larger decline. This pattern reflects a balance between buying and selling pressure.
The pattern of lower highs and higher lows indicates a decrease in volatility, and this is usually a precursor to a significant move. A breakout above the upper boundary with high volume may indicate a relief rally.
And a breakdown below support levels may indicate a continuation of existing bearish momentum. Until then, Mantle is simply consolidating and not indicating any trend reversal.
Also Read | Bitcoin Drops as Bhutan Moves 100 BTC ($6.77 million) to Institutional Wallet
Mantle Sellers Dominate Weekly Charts
The technical indicators on the weekly chart are on the side of sellers. Mantle’s RSI is in the mid-30s, below average, indicating low momentum.
The moving average ribbon shows ongoing pressure on the asset, with the price significantly below the 100-week and 200-week SMAs. In the $0.60 area, the trend is still bearish, with buyers attempting to contain the price.
The momentum indicators from MACD also support our outlook, as MACD is still below its signal line with a negative histogram. The moderate line separation also supports that bearish momentum is still dominant on higher timeframes.
Overall, Mantle’s structure indicates that the market is waiting for a catalyst to make a decisive move outside of the triangle. This will define the next movement, whether it will continue to fall or recover.
Also Read | PEPE Price Analysis: Can $0.0000034 Hold as Momentum Softens?
You May Also Like
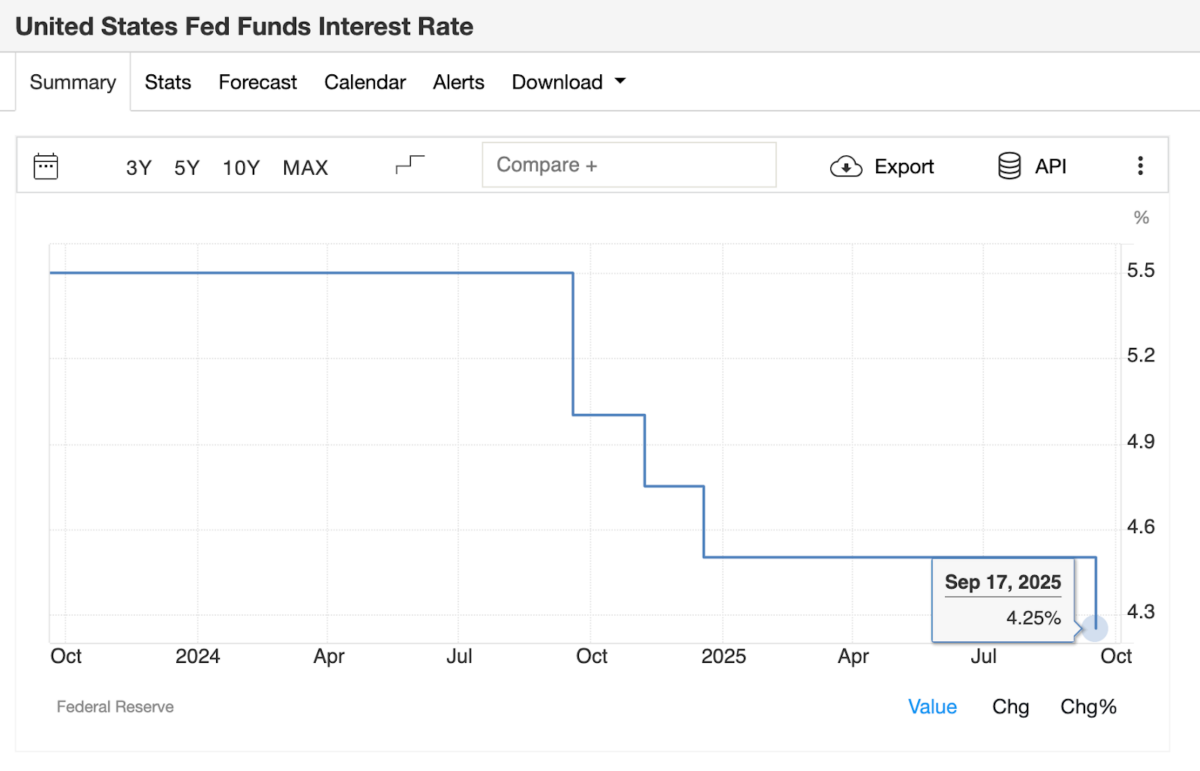
Bitcoin Holds $115K Support as Fed Cuts Rates by 25 Basis Points
XRP Whales Offload 200 Million XRP as Market Pauses Near $3
