Bitcoin is trading above $112K again as major catalysts unfold. From the Trump family–backed American Bitcoin going public to BlackRock buying ETH.Bitcoin is trading above $112K again as major catalysts unfold. From the Trump family–backed American Bitcoin going public to BlackRock buying ETH.

Bitcoin Price Back Above $112K As Positive BTC NEWS Hits

2025/08/28 20:16
2 min read

Bitcoin Price Reclaims $112K

Bitcoin ($BTC) has bounced back above the $112,000 mark, regaining a critical level that many traders view as short-term support. Despite recent volatility, institutional flows and macro developments suggest that the broader bull cycle may be entering a new phase.

BTCUSD_2025-08-28_15-14-02.png

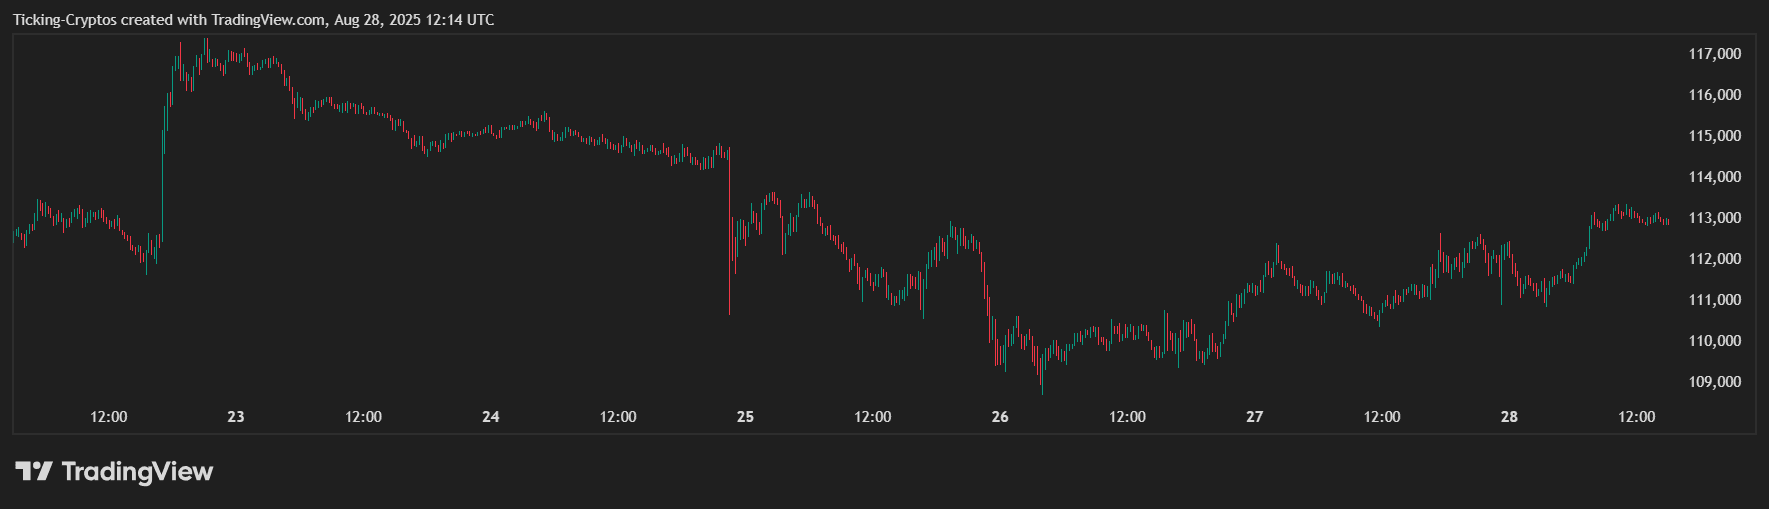
BTC/USD price in the past week - TradingView

Trump Family–Backed American Bitcoin to Go Public

Reports confirm that American Bitcoin, backed by Eric and Donald Trump Jr., is preparing to go public in September through a merger with Gryphon Digital Mining. A stockholder vote was held yesterday, clearing a key hurdle for the listing. The move marks a significant milestone for U.S.-based Bitcoin initiatives, tying political influence with blockchain infrastructure.

BlackRock Buys $262.6 Million Worth of Ethereum

In another major development, BlackRock disclosed a $262.6 million purchase of Ethereum ($ETH). This reinforces the growing narrative that large asset managers are diversifying beyond $Bitcoin into alternative crypto assets. Institutional confidence in Ethereum continues to rise, especially after the strong inflows into U.S. Spot-ETH ETFs.

Fed Rate Cut Odds Now at 87%

The macro backdrop also adds fuel to the crypto market. According to CME FedWatch, the odds of a U.S. Federal Reserve rate cut in September are now at 87%. A dovish Fed has historically provided liquidity tailwinds for risk assets, with crypto often among the biggest beneficiaries.

Market Outlook: Parabolic Phase Ahead?

Some analysts suggest that the recent crypto market “dumps” are less about fundamentals and more about shaking out weak hands before institutional players accumulate positions. If true, the current consolidation could precede a parabolic phase in both $Bitcoin and $Ethereum as retail and institutional demand align.

Market Opportunity
OFFICIAL TRUMP Logo
OFFICIAL TRUMP Price(TRUMP)
$3.398
$3.398$3.398
+0.20%
USD
OFFICIAL TRUMP (TRUMP) Live Price Chart
Disclaimer: The articles reposted on this site are sourced from public platforms and are provided for informational purposes only. They do not necessarily reflect the views of MEXC. All rights remain with the original authors. If you believe any content infringes on third-party rights, please contact service@support.mexc.com for removal. MEXC makes no guarantees regarding the accuracy, completeness, or timeliness of the content and is not responsible for any actions taken based on the information provided. The content does not constitute financial, legal, or other professional advice, nor should it be considered a recommendation or endorsement by MEXC.
Tags:

You May Also Like

Microsoft Corp. $MSFT blue box area offers a buying opportunity

Microsoft Corp. $MSFT blue box area offers a buying opportunity

The post Microsoft Corp. $MSFT blue box area offers a buying opportunity appeared on BitcoinEthereumNews.com. In today’s article, we’ll examine the recent performance of Microsoft Corp. ($MSFT) through the lens of Elliott Wave Theory. We’ll review how the rally from the April 07, 2025 low unfolded as a 5-wave impulse followed by a 3-swing correction (ABC) and discuss our forecast for the next move. Let’s dive into the structure and expectations for this stock. Five wave impulse structure + ABC + WXY correction $MSFT 8H Elliott Wave chart 9.04.2025 In the 8-hour Elliott Wave count from Sep 04, 2025, we saw that $MSFT completed a 5-wave impulsive cycle at red III. As expected, this initial wave prompted a pullback. We anticipated this pullback to unfold in 3 swings and find buyers in the equal legs area between $497.02 and $471.06 This setup aligns with a typical Elliott Wave correction pattern (ABC), in which the market pauses briefly before resuming its primary trend. $MSFT 8H Elliott Wave chart 7.14.2025 The update, 10 days later, shows the stock finding support from the equal legs area as predicted allowing traders to get risk free. The stock is expected to bounce towards 525 – 532 before deciding if the bounce is a connector or the next leg higher. A break into new ATHs will confirm the latter and can see it trade higher towards 570 – 593 area. Until then, traders should get risk free and protect their capital in case of a WXY double correction. Conclusion In conclusion, our Elliott Wave analysis of Microsoft Corp. ($MSFT) suggested that it remains supported against April 07, 2025 lows and bounce from the blue box area. In the meantime, keep an eye out for any corrective pullbacks that may offer entry opportunities. By applying Elliott Wave Theory, traders can better anticipate the structure of upcoming moves and enhance risk management in volatile markets. Source: https://www.fxstreet.com/news/microsoft-corp-msft-blue-box-area-offers-a-buying-opportunity-202509171323
Share
BitcoinEthereumNews2025/09/18 03:50
XRP Buyers Defend Most Major 200-Week Price Average: Can It Be Bottom of 2026?

XRP Buyers Defend Most Major 200-Week Price Average: Can It Be Bottom of 2026?

The post XRP Buyers Defend Most Major 200-Week Price Average: Can It Be Bottom of 2026? appeared on BitcoinEthereumNews.com. XRP has returned to its 200-week moving
Share
BitcoinEthereumNews2026/02/08 19:49
Expert Tags Ethereum’s ERC-8004 Mainnet Launch An “iPhone Moment”, Here’s What It Means

Expert Tags Ethereum’s ERC-8004 Mainnet Launch An “iPhone Moment”, Here’s What It Means

Market analyst says Ethereum is having an “iPhone moment” as it approaches the ERC-8004 mainnet launch.
Share
Coinstats2026/02/08 19:56