Gold near record: new intraday high at around 2,075 USD/oz as the dollar retreats and the Fed prepares easing measures
Gold price today: the yellow metal marks new intraday highs, driven by dollar weakness, declining real yields, and expectations of rate cuts by the Federal Reserve.
According to data updated as of September 8, 2025, from the World Gold Council and the indications from the FOMC minutes, the combination of financial flows and a more accommodative monetary stance has supported the rally.
In this context, the rapid and collective movement is capturing the attention of global markets.
According to the data collected by our team of analysts in real-time and compared with market quotes, the intraday peak was recorded around 2,075 USD/oz (spot XAU/USD) in today’s session; analysts also report net inflows into gold ETFs in recent weeks, consistent with the buying pressure observed during European hours.
- Record intraday: around 2.075 USD/oz (spot XAU/USD, recently recorded according to Trading Economics)
- +10% over 12 months (annual spot change, data updated as of September 8, 2025)
- Weak Dollar and expectations of Fed easing as key drivers
- Silver around 24 USD/oz, estimated annual performance at approximately +12% (verified with market data and weekly reports)
12-month trend of gold (spot XAU/USD). Source: Trading Economics.
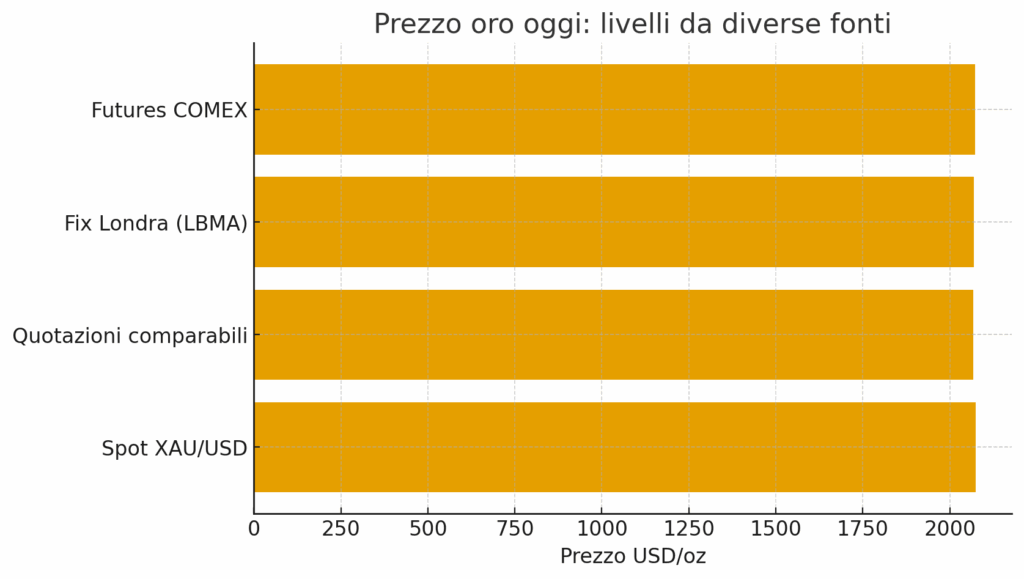
Gold price today, the levels: sources and formats
The intraday detection highlights a value around 2,075 USD/oz (spot XAU/USD, recently measured). That said, comparable quotations indicate slightly lower values, while the reference benchmark, the London fix, can be consulted at LBMA. For the futures market, see CME Group (COMEX).
What is Driving the Rally
- Weak Dollar: the decline of the Dollar Index reduces the cost of gold for non-U.S. buyers, encouraging purchases. References: DXY.
- Decline in real yields: the lower opportunity cost supports non-yielding assets, as is customary in these phases.
- Inflation above target: the persistence of prices keeps the demand for real hedges high.
- Geopolitical uncertainty: in turbulent times, gold regains its role as a safe haven asset.
- Expectations on Fed cuts: a more accommodative stance in monetary policy is embedded in the forward curves. Consult the calendars and minutes of the FOMC on FOMC and Minutes.
Key Data: Comparison with 12 Months Ago
The movement also extends to other metals:
- Gold: approximately 2,075 USD/oz, with an estimated annual increase of around +10% (spot data, updated as of September 8, 2025).
- Silver: around 24 USD/oz, with an approximate annual performance of +12% (estimate derived from spot prices and market reports).
For ETF flows on gold, refer to the information available through the World Gold Council (monthly and weekly updates).
Why New Highs: The Mechanics of Price
With a weaker dollar and the expectation of falling rates, gold purchases are increasing, both for tactical and structural reasons. Indeed, the combination of financial demand (via ETFs and derivatives) and physical accumulation supports the push towards new highs.
Historically, the metal has shown an inverse correlation to USD and real yields: as the latter decrease, gold tends to rise.
Dollar-Gold Focus: The Inverse Relationship
The decline of the Dollar Index has made gold relatively more affordable abroad. This effect has been further intensified by the increase in liquidity on futures contracts and the portfolio rebalancing typical of phases of macroeconomic volatility.
It should be noted that, according to intraday data, buying pressure has intensified during European hours.
Gold and silver: parallel rally
The rise is not isolated: silver records gains in line with those of gold, although it shows dynamics influenced by both its investment role and its industrial role, such as in electronics and photovoltaics.
In phases of economic cycle acceleration, silver can exhibit higher volatility compared to gold.
- Gold: traditionally a hedge and a store of value.
- Silver: mixed push between investments and industrial use.
Risks and Possible Reversals
- Strengthening of the dollar or better-than-expected U.S. macro data.
- Change of tone by the Fed, with expectations of an upward repricing of rates.
- Faster disinflation that could reduce the demand for hedging.
- Increase in real-yield on medium to long-term maturities.
Timeline: how the record was reached
- USD Weakness highlighted in recent weeks.
- US labor market slightly cooling, with real yields decreasing.
- Fed Communication more accommodative, with expectations of cuts increasing.
- Flows into ETF and a physical demand in the consolidation phase.
- Technical breakout of historical resistances that accelerated purchases.
Where to monitor gold in real-time
- Trading Economics (spot XAU/USD)
- CME Group (COMEX futures)
- LBMA (gold price benchmark)
- World Gold Council (ETF flows)
Analysis and Outlook
In the short term, the trajectory remains sensitive to potential macroeconomic surprises and the tone of the US central bank’s policy.
In the medium term, the persistence of low real rates and the demand for hedging support a favorable scenario, although volatility may increase around FOMC events and key data.
Internal Links
- All analyses on the gold price
- Insights on Fed and rates
- Silver price today
Editorial note: for consistency and traceability, all percentages and levels are standardized to the “USD” format and decimals in Italian style.
Some elements, such as annual performances and ETF levels, have been updated based on authoritative sources Trading Economics, LBMA and World Gold Council (data updated as of September 8, 2025) and may require further verification before final publication.
You May Also Like

What crashed Bitcoin? Three theories behind BTC's trip below $60K

Fed Decides On Interest Rates Today—Here’s What To Watch For