TAO has seen better days. Bittensor is currently trading at around $201 on the weekly chart after plummeting from its all-time highs above $500. This has been aTAO has seen better days. Bittensor is currently trading at around $201 on the weekly chart after plummeting from its all-time highs above $500. This has been a

Analyst Stands Firm on Bittensor (TAO) $500 Target Despite Recent Pullback

2026/03/13 08:00
4 min read
For feedback or concerns regarding this content, please contact us at crypto.news@mexc.com

TAO has seen better days. Bittensor is currently trading at around $201 on the weekly chart after plummeting from its all-time highs above $500. This has been a tough ride, and prices have declined by over 60% from their peak. Yet, there is a story brewing beneath all this. It has analysts calling this a buying opportunity rather than a reason to run.

Crypto analyst 2xnmore remains bullish on TAO, calling it the top AI pick in crypto to date. His thesis centers on the decentralized network powering real-world AI applications, a use case that separates TAO from speculative tokens with no fundamental backing. The chart shows the pullback, but the fundamentals scream opportunity.

The TAO Weekly Chart Reveals the Full Picture

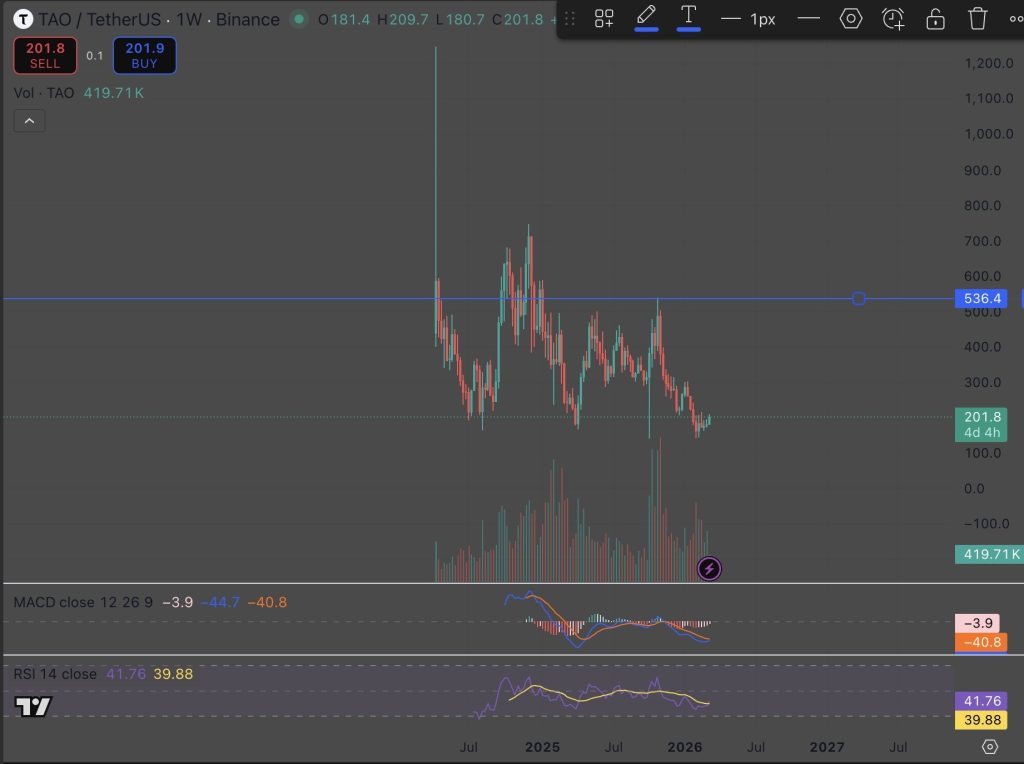
The same is shown on 2xnmore’s LINK article above for potential grammatical errors and fix them. Do not rewrite the rest of the text. and show me where the errors are in the weekly chart. TAO has gone from $100 to $500+ within a short time from 2024 to 2025. Anyone who caught this ride saw significant gains.. However, after that ride, a long correction has caused the price to fall by 60%, from $500+ to $201.

As you can see from this chart, it is a textbook bear market. The only problem is that volume is falling along with the price. However, it is apparent that selling pressure is easing up.

What is interesting is that instead of falling to nothing like most other prices during a bear market, TAO has remained above its pre-rally levels and has been trading within a range of $180-$250. This is a common sign that a new run may begin when the market turns around.

Source: X/@2xnmore

From a technical perspective, it is also apparent that a new rally is about to begin.The RSI is currently at 41.76, closing in on the oversold region. This is the second time it has reached a similar level, with the last being 39.88. 

As for the MACD, it is at -3.9, with the signal line at -44.7. The gap between them is closing,indicating a decrease in bear. The volume at 419,710 TAO is low compared to the rally highs. This is a sign that a consolidation is occurring.

The Fundamental Case for TAO

2xnmore’s bullish thesis rests on fundamentals, not charts. TAO powers a decentralized machine learning network with real users and infrastructure. 

While countless AI tokens faded, TAO maintained development and community engagement throughout the bear market. That resilience matters when capital rotates back into AI narratives. His $500 target represents more than double the current TAO price, plausible if the broader market cooperates.

Not every fallen angel flies again. The TAO price could consolidate or break lower. The weekly chart shows no clear reversal yet. Support levels are around $180, with a second level at $150. If the price falls below these levels, a fall to $100 is a strong possibility. 

This would negate the bullish argument. For now, TAO is consolidating, fundamentals are strong, and analysts are seeing opportunities that others are missing as the price drifts lower.

Read Also: $320M Buybacks, Yet PUMP PriceKeeps Crashing – What’s Really Happening With Pump.fun?

What Comes Next for the TAO Price

The TAO price sits at a level where fundamentals and technicals are starting to align. The pullback has been deep enough to shake out weak hands. The network continues building real-world AI applications. 

The weekly chart shows consolidation rather than freefall. And analysts like 2xnmore are calling this a buying opportunity. For the TAO price to reach $500, it would need to reclaim the $250 level first, then break through the $300 to $350 resistance zone. 

Above that, the path opens toward the all-time highs and eventually the target. The setup exists. The question is whether the broader market provides the tailwind needed to complete the journey.

Subscribe to our YouTube channel for daily crypto updates, market insights, and expert analysis.

The post Analyst Stands Firm on Bittensor (TAO) $500 Target Despite Recent Pullback appeared first on CaptainAltcoin.

Market Opportunity
Bittensor Logo
Bittensor Price(TAO)
$239.6
$239.6$239.6
+12.94%
USD
Bittensor (TAO) Live Price Chart
Disclaimer: The articles reposted on this site are sourced from public platforms and are provided for informational purposes only. They do not necessarily reflect the views of MEXC. All rights remain with the original authors. If you believe any content infringes on third-party rights, please contact crypto.news@mexc.com for removal. MEXC makes no guarantees regarding the accuracy, completeness, or timeliness of the content and is not responsible for any actions taken based on the information provided. The content does not constitute financial, legal, or other professional advice, nor should it be considered a recommendation or endorsement by MEXC.

You May Also Like

Trump Wants Rate Cuts Now — The Iran War and Oil Prices Say Otherwise

Trump Wants Rate Cuts Now — The Iran War and Oil Prices Say Otherwise

TLDR Trump posted on Truth Social demanding Fed Chair Powell cut rates “immediately” rather than wait for next week’s FOMC meeting. Markets have priced out most
Share
Coincentral2026/03/13 15:54
UK GDP arrives at 0% MoM in January vs. 0.2% expected

UK GDP arrives at 0% MoM in January vs. 0.2% expected

The post UK GDP arrives at 0% MoM in January vs. 0.2% expected appeared on BitcoinEthereumNews.com. The UK Gross Domestic Product (GDP) arrived at 0% MoM in January
Share
BitcoinEthereumNews2026/03/13 15:59
Egrag Crypto: XRP Could be Around $6 or $7 by Mid-November Based on this Analysis

Egrag Crypto: XRP Could be Around $6 or $7 by Mid-November Based on this Analysis

Egrag Crypto forecasts XRP reaching $6 to $7 by November. Fractal pattern analysis suggests a significant XRP price surge soon. XRP poised for potential growth based on historical price patterns. The cryptocurrency community is abuzz after renowned analyst Egrag Crypto shared an analysis suggesting that XRP could reach $6 to $7 by mid-November. This prediction is based on the study of a fractal pattern observed in XRP’s past price movements, which the analyst believes is likely to repeat itself in the coming months. According to Egrag Crypto, the analysis hinges on fractal patterns, which are used in technical analysis to identify recurring market behavior. Using the past price charts of XRP, the expert has found a certain fractal that looks similar to the existing market structure. The trend indicates that XRP will soon experience a great increase in price, and the asset will probably reach the $6 or $7 range in mid-November. The chart shared by Egrag Crypto points to a rising trend line with several Fibonacci levels pointing to key support and resistance zones. This technical structure, along with the fractal pattern, is the foundation of the price forecast. As XRP continues to follow the predicted trajectory, the analyst sees a strong possibility of it reaching new highs, especially if the fractal behaves as expected. Also Read: Why XRP Price Remains Stagnant Despite Fed Rate Cut #XRP – A Potential Similar Set-Up! I've been analyzing the yellow fractal from a previous setup and trying to fit it into various formations. Based on the fractal formation analysis, it suggests that by mid-November, #XRP could be around $6 to $7! Fractals can indeed be… pic.twitter.com/HmIlK77Lrr — EGRAG CRYPTO (@egragcrypto) September 18, 2025 Fractal Analysis: The Key to XRP’s Potential Surge Fractals are a popular tool for market analysis, as they can reveal trends and potential price movements by identifying patterns in historical data. Egrag Crypto’s focus on a yellow fractal pattern in XRP’s price charts is central to the current forecast. Having contrasted the market scenario at the current period and how it was at an earlier time, the analyst has indicated that XRP might revert to the same price scenario that occurred at a later cycle in the past. Egrag Crypto’s forecast of $6 to $7 is based not just on the fractal pattern but also on broader market trends and technical indicators. The Fibonacci retracements and extensions will also give more insight into the price levels that are likely to be experienced in the coming few weeks. With mid-November in sight, XRP investors and traders will be keeping a close eye on the market to see if Egrag Crypto’s analysis is true. If the price targets are reached, XRP could experience one of its most significant rallies in recent history. Also Read: Top Investor Issues Advance Warning to XRP Holders – Beware of this Risk The post Egrag Crypto: XRP Could be Around $6 or $7 by Mid-November Based on this Analysis appeared first on 36Crypto.
Share
Coinstats2025/09/18 18:36