Kaspa (KAS) is showing serious resilience even as its price remains near lows. Kaspa’s hash rate is holding near all-time highs, showing miners aren’t steppingKaspa (KAS) is showing serious resilience even as its price remains near lows. Kaspa’s hash rate is holding near all-time highs, showing miners aren’t stepping

Where Could Kaspa (KAS) Price Go This Week?

2026/03/22 18:00
3 min read
For feedback or concerns regarding this content, please contact us at crypto.news@mexc.com

Kaspa (KAS) is showing serious resilience even as its price remains near lows. Kaspa’s hash rate is holding near all-time highs, showing miners aren’t stepping back and the network’s backbone is rock solid.

A major hardfork is coming on May 5, bringing native tokens and more programmability. This could open the door to DeFi, NFTs, and all kinds of new ways for developers to build on Kaspa.

Meanwhile, Rusty Kaspa v1.1.0 is out, making the network faster and smoother for developers. In all these developments, it is clear that the project is playing the long game rather than focusing on the price.

Here’s What The Kaspa Chart is Showing

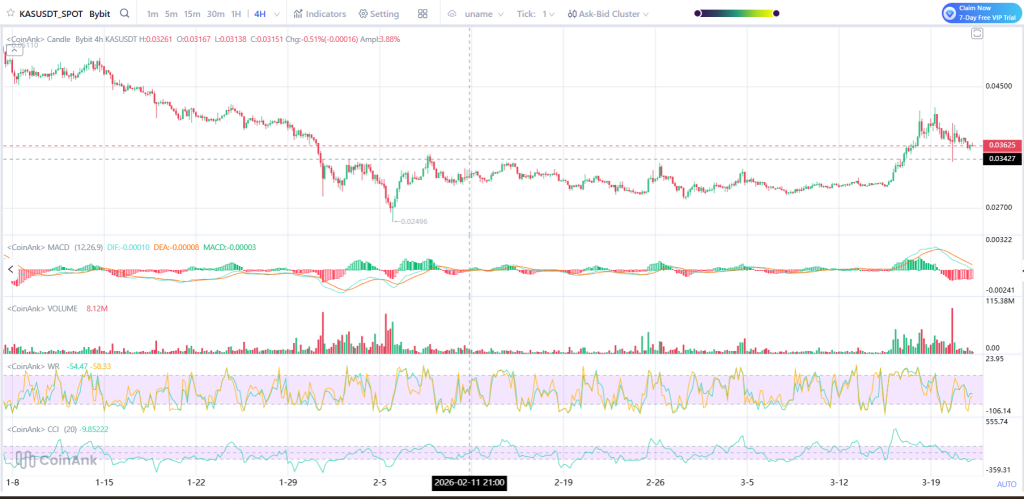
On the 4-hour chart, the KAS price has spent the past few weeks in a steady downtrend, forming lower highs and lower lows. The structure started to change once the price found a footing around $0.0249.

It spent some time drifting sideways, gathering energy, before surging past $0.034 with solid momentum.

That move signaled buyers returning to the market. Right now, KAS is trading near $0.03626, taking a small breather after the recent rally This kind of movement is typical after a sharp push higher, as the market takes time to cool off and reassess direction.

Source: Coinank

Market Indicators

The MACD flipped bullish during the breakout, which showed strong momentum at the time. But now it’s starting to cool off a bit, meaning the rally is slowing down, not necessarily reversing.

Volume tells a similar story. It spiked during the move up, which is a good sign, but it’s dropping now as traders pause and wait for the next direction.

Williams %R went into overbought levels and is pulling back, suggesting the KAS price might take a short break or dip slightly.

CCI is also coming down after the spike, showing that momentum is easing off for now rather than turning fully bearish.

Read Also: Could the Bittensor (TAO) Rally Be Over? Fundamentals and Sentiment Point in Opposite Directions

Here’s Where Kaspa Price Could Go This Week

$0.034 is the line in the sand right now. As long as buyers keep their grip here, Kaspa could quietly creep up toward $0.038–$0.040.

Breaking past $0.040 with conviction would flip the switch, potentially sending it to $0.042 and even $0.045 if the market mood stays positive.

But if $0.034 cracks, the setup starts to unravel. A fall toward $0.030–$0.031 would be likely, and if selling heats up, $0.027 is the next solid landing spot for KAS price where buyers have stepped in before.

However, Kaspa (KAS) is now displaying early signs of a recovery from a prolonged period of decline. From the above chart, it is evident that the price of Kaspa is breaking out with strong volumes, indicating the entry of buyers into the market. At the same time, the price is also displaying signs of a cooling period.

So long as the Kaspa price trades above the key levels of the chart, the structure of the price is gradually favoring the bulls. With strong fundamentals and upcoming network upgrades, Kaspa is now building a foundation for a possible price action.

Subscribe to our YouTube channel for daily crypto updates, market insights, and expert analysis.

The post Where Could Kaspa (KAS) Price Go This Week? appeared first on CaptainAltcoin.

Market Opportunity
Kaspa Logo
Kaspa Price(KAS)
$0,035107
$0,035107$0,035107
-0,90%
USD
Kaspa (KAS) Live Price Chart
Disclaimer: The articles reposted on this site are sourced from public platforms and are provided for informational purposes only. They do not necessarily reflect the views of MEXC. All rights remain with the original authors. If you believe any content infringes on third-party rights, please contact crypto.news@mexc.com for removal. MEXC makes no guarantees regarding the accuracy, completeness, or timeliness of the content and is not responsible for any actions taken based on the information provided. The content does not constitute financial, legal, or other professional advice, nor should it be considered a recommendation or endorsement by MEXC.

You May Also Like

XRP News: Regulatory Clarity Lifts Markets as Pepeto Nears Exchange Listings

XRP News: Regulatory Clarity Lifts Markets as Pepeto Nears Exchange Listings

According to market analysts, the SEC classifying 18 tokens as digital commodities could improve liquidity conditions across the entire market in the xrp news this
Share
Techbullion2026/03/24 03:09
Cryptos Signal Divergence Ahead of Fed Rate Decision

Cryptos Signal Divergence Ahead of Fed Rate Decision

The post Cryptos Signal Divergence Ahead of Fed Rate Decision appeared on BitcoinEthereumNews.com. Crypto assets send conflicting signals ahead of the Federal Reserve’s September rate decision. On-chain data reveals a clear decrease in Bitcoin and Ethereum flowing into centralized exchanges, but a sharp increase in altcoin inflows. The findings come from a Tuesday report by CryptoQuant, an on-chain data platform. The firm’s data shows a stark divergence in coin volume, which has been observed in movements onto centralized exchanges over the past few weeks. Bitcoin and Ethereum Inflows Drop to Multi-Month Lows Sponsored Sponsored Bitcoin has seen a dramatic drop in exchange inflows, with the 7-day moving average plummeting to 25,000 BTC, its lowest level in over a year. The average deposit per transaction has fallen to 0.57 BTC as of September. This suggests that smaller retail investors, rather than large-scale whales, are responsible for the recent cash-outs. Ethereum is showing a similar trend, with its daily exchange inflows decreasing to a two-month low. CryptoQuant reported that the 7-day moving average for ETH deposits on exchanges is around 783,000 ETH, the lowest in two months. Other Altcoins See Renewed Selling Pressure In contrast, other altcoin deposit activity on exchanges has surged. The number of altcoin deposit transactions on centralized exchanges was quite steady in May and June of this year, maintaining a 7-day moving average of about 20,000 to 30,000. Recently, however, that figure has jumped to 55,000 transactions. Altcoins: Exchange Inflow Transaction Count. Source: CryptoQuant CryptoQuant projects that altcoins, given their increased inflow activity, could face relatively higher selling pressure compared to BTC and ETH. Meanwhile, the balance of stablecoins on exchanges—a key indicator of potential buying pressure—has increased significantly. The report notes that the exchange USDT balance, around $273 million in April, grew to $379 million by August 31, marking a new yearly high. CryptoQuant interprets this surge as a reflection of…
Share
BitcoinEthereumNews2025/09/18 01:01
What The Current Dogecoin Momentum Means For The Meme Coin’s Price

What The Current Dogecoin Momentum Means For The Meme Coin’s Price

A new technical reading shows that Dogecoin’s price structure is not as weak as the surface-level price action might imply. In a recent post on X, crypto analyst
Share
Bitcoinist2026/03/24 03:00