Bitcoin ETF Outflows Hit $225M as ETH and SOL Spot Funds Also Bleed
U.S. spot crypto ETFs posted a combined net outflow of $281.8 million on March 27, 2026, with Bitcoin funds absorbing the heaviest losses at $225 million. Ethereum and Solana ETFs also bled capital, while XRP products were the sole category to hold flat at zero.
The session marked the fifth consecutive day of net outflows from crypto ETF products, extending a streak that has now drained nearly half a billion dollars from institutional crypto allocations in under a week.
BTC Leads the Selloff With $225M in Net Outflows
U.S. spot Bitcoin ETFs recorded -$225.5 million in net outflows on the day. BlackRock’s iShares Bitcoin Trust (IBIT) accounted for the bulk of the damage, shedding $201.5 million in a single session, the largest individual fund outflow of the day.
Bitcoin’s dominance in the outflow total is stark. BTC funds lost $225 million compared to a combined $56.3 million for Ethereum and Solana ETFs. Across 11 active Bitcoin ETF products, total assets under management stand at $95.69 billion.
BTC spot price fell 3.39% to $66,399 on the same day, confirming that the ETF-level retreat coincided with broader selling pressure in the underlying asset. Trading volume across Bitcoin markets reached $47.3 billion.
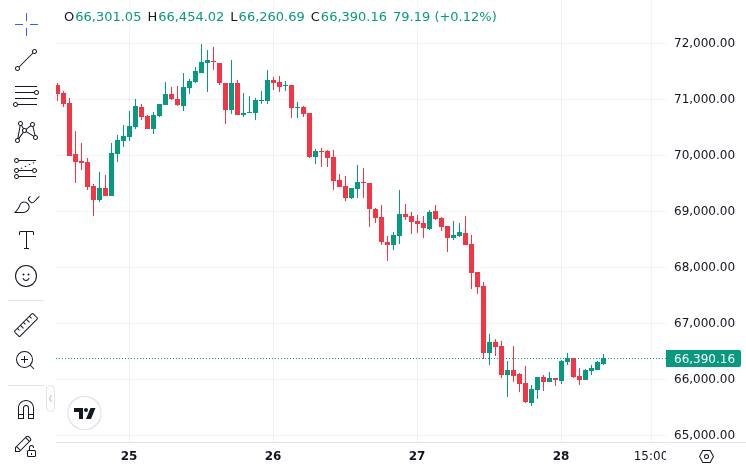 CoinMarketCap market snapshot used to anchor the spot-price section for bitcoin.
Ethereum spot ETFs posted -$48.5 million in net outflows across 9 active funds with combined AUM of $21.76 billion. Within the Ethereum category, a notable divergence emerged: BlackRock’s ETHA saw -$70.8 million in outflows, while ETHB attracted +$39.9 million in inflows, making it the session’s standout performer. ETH price declined 3.01% to $2,001.
Solana spot ETFs lost -$7.8 million across 5 active products with a combined AUM of $476 million, the smallest absolute outflow among the three negative categories. SOL price dropped 3.61% to $83.08, the steepest percentage decline of the four major crypto assets tracked.
Three-Asset Simultaneous Outflows Signal Broad Risk-Off Positioning
When BTC, ETH, and SOL all post negative ETF flows in the same session, it signals coordinated de-risking rather than single-asset rotation. In a rotation scenario, capital leaving one crypto ETF typically flows into another. That did not happen here.
The combined outflow across all three assets totaled approximately $281.8 million. No major crypto ETF category recorded meaningful offsetting inflows on March 27, removing the possibility that institutional investors were simply rebalancing between assets.
The five-day cumulative outflow now stands at -$496.5 million, a figure that reinforces the institutional risk-off posture. This pattern, where multiple uncorrelated crypto assets decline through ETF channels simultaneously, typically reflects macro-driven sentiment rather than asset-specific catalysts. The Crypto Fear & Greed Index sits at 12, deep in “Extreme Fear” territory.
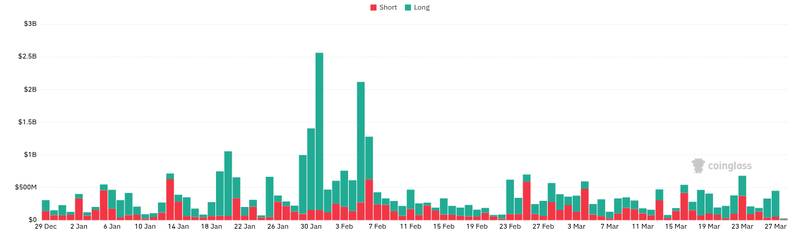 CoinGlass market-structure view used for the leverage and volatility section on bitcoin.
The scale of the pullback is worth considering in context. Total crypto ETF AUM across 29 active products from 11 issuers remains at $119.06 billion. The five-day outflow of $496.5 million represents roughly 0.42% of that total, a meaningful flow signal but not yet a structural unwind.
The trend echoes a similar dynamic seen earlier in March, when Ark Invest’s Bitcoin ETF lost $30 million as part of a broader $171 million single-day outflow event. That session also featured multi-asset selling across spot ETF products.
XRP Holds Flat, the One Divergence in an Otherwise Negative Session
XRP spot ETFs recorded exactly $0 in net flows on March 27, neither inflows nor outflows. Across 4 active XRP ETF products with combined AUM of $1.13 billion, the category was the only major crypto ETF segment to avoid losses on the day.
The flat reading deserves measured interpretation. XRP ETF products launched more recently than their BTC and ETH counterparts and carry significantly smaller AUM. Zero net flow on a broadly negative day could indicate relative demand stability among XRP holders, or it could simply reflect lower trading activity in a smaller, less liquid product category.
XRP’s spot price declined just 1.90% to $1.34, the mildest drop among the four tracked assets. That relative resilience in both price and ETF flows makes XRP the session’s clearest outlier, though it stops short of constituting a bullish signal. The evolving regulatory landscape for digital assets may be contributing to steady institutional positioning in the XRP ETF category.
For investors tracking institutional flows as a leading indicator, the March 27 session reinforces a clear pattern: capital is leaving crypto ETF products across the board. The question now is whether the five-day outflow streak extending to nearly $500 million marks a short-term repositioning or the beginning of a more sustained withdrawal. Upcoming ETF flow data will clarify whether the broad-based selloff is stabilizing or deepening. Developments in new ETF product launches and fee competition could also influence fund-level dynamics in the weeks ahead.
Disclaimer: This article is for informational purposes only and does not constitute financial or investment advice. Cryptocurrency and digital asset markets carry significant risk. Always do your own research before making decisions.
You May Also Like

A Game-Changing Leap For DeFi Interoperability

Arbitrageurs profited over $40 million from pricing mismatches on Polymarket in a single year.