On-chain analytics firm Glassnode has explained how the latest Bitcoin selloff is different from the LUNA and FTX crashes of 2022. Bitcoin Supply In Profit Trend Is Structurally Different For The Latest Crash In a new post on X, Glassnode has discussed how the recent bearish action in BTC compares against some of the past crashes. The analytics firm has used the Percent Supply in Profit to make the comparison. This on-chain indicator measures, as its name suggests, the percentage of the total Bitcoin circulating supply that’s sitting on some net unrealized gain right now. Related Reading: BNB Shoots Up 6%: Is This Just The Start Of A Run To $2,400? The metric works by going through the transaction history of each token in circulation to see what price it was last transferred or sold at. If this previous transaction price was less than the latest spot price for any token, then it may be considered to be currently sitting on some profit. The Percent Supply in Profit adds up all coins of this type and determines what percentage of the supply they make up. Another indicator called the Percent Supply in Loss tracks the tokens of the opposite type. If one of these indicators is known, the other can simply be calculated by subtracting it from 100, since the total BTC supply must add up to 100%. Now, here is the chart shared by Glassnode that shows the trend in the Bitcoin Percent Supply in Profit over the last few years: As is visible in the above graph, the Bitcoin Percent Supply in Profit hit the 100% mark earlier in the month when the cryptocurrency’s price set its new all-time high (ATH). When the sharp selloff at the end of last week started, the indicator’s value was still well over the 90% mark, meaning the vast majority of investors were in the green. As such, the crash was more profit-driven, with losses mostly coming from the top buyers. During some of the big crashes of the 2022 bear market, however, the market conditions were quite different. In the LUNA and FTX collapses, the Percent Supply in Profit sat under 65%. In the chart, Glassnode has also highlighted the data of another metric: the Net Realized Profit/Loss, measuring whether profit-taking or loss-taking is dominant on the BTC network. From this indicator, it’s apparent that the aforementioned crashes saw deep negative values, implying a broad capitulation event took place. Related Reading: Bitcoin Direction Still Unclear: Analyst Says Watch These Key Charts The 3AC collapse occurred alongside a higher Percent Supply in Profit, but it also witnessed a notable spike in loss-taking. Based on this, Glassnode concludes that the latest Bitcoin crash was “a structurally different, leverage-driven event.” BTC Price At the time of writing, Bitcoin is trading around $110,400, down more than 11% over the last week. Featured image from Dall-E, Glassnode.com, chart from TradingView.comOn-chain analytics firm Glassnode has explained how the latest Bitcoin selloff is different from the LUNA and FTX crashes of 2022. Bitcoin Supply In Profit Trend Is Structurally Different For The Latest Crash In a new post on X, Glassnode has discussed how the recent bearish action in BTC compares against some of the past crashes. The analytics firm has used the Percent Supply in Profit to make the comparison. This on-chain indicator measures, as its name suggests, the percentage of the total Bitcoin circulating supply that’s sitting on some net unrealized gain right now. Related Reading: BNB Shoots Up 6%: Is This Just The Start Of A Run To $2,400? The metric works by going through the transaction history of each token in circulation to see what price it was last transferred or sold at. If this previous transaction price was less than the latest spot price for any token, then it may be considered to be currently sitting on some profit. The Percent Supply in Profit adds up all coins of this type and determines what percentage of the supply they make up. Another indicator called the Percent Supply in Loss tracks the tokens of the opposite type. If one of these indicators is known, the other can simply be calculated by subtracting it from 100, since the total BTC supply must add up to 100%. Now, here is the chart shared by Glassnode that shows the trend in the Bitcoin Percent Supply in Profit over the last few years: As is visible in the above graph, the Bitcoin Percent Supply in Profit hit the 100% mark earlier in the month when the cryptocurrency’s price set its new all-time high (ATH). When the sharp selloff at the end of last week started, the indicator’s value was still well over the 90% mark, meaning the vast majority of investors were in the green. As such, the crash was more profit-driven, with losses mostly coming from the top buyers. During some of the big crashes of the 2022 bear market, however, the market conditions were quite different. In the LUNA and FTX collapses, the Percent Supply in Profit sat under 65%. In the chart, Glassnode has also highlighted the data of another metric: the Net Realized Profit/Loss, measuring whether profit-taking or loss-taking is dominant on the BTC network. From this indicator, it’s apparent that the aforementioned crashes saw deep negative values, implying a broad capitulation event took place. Related Reading: Bitcoin Direction Still Unclear: Analyst Says Watch These Key Charts The 3AC collapse occurred alongside a higher Percent Supply in Profit, but it also witnessed a notable spike in loss-taking. Based on this, Glassnode concludes that the latest Bitcoin crash was “a structurally different, leverage-driven event.” BTC Price At the time of writing, Bitcoin is trading around $110,400, down more than 11% over the last week. Featured image from Dall-E, Glassnode.com, chart from TradingView.com

Bitcoin Crash Unlike LUNA & FTX Collapses, Says Glassnode: Here’s Why

2025/10/15 13:00

On-chain analytics firm Glassnode has explained how the latest Bitcoin selloff is different from the LUNA and FTX crashes of 2022.

Bitcoin Supply In Profit Trend Is Structurally Different For The Latest Crash

In a new post on X, Glassnode has discussed how the recent bearish action in BTC compares against some of the past crashes. The analytics firm has used the Percent Supply in Profit to make the comparison. This on-chain indicator measures, as its name suggests, the percentage of the total Bitcoin circulating supply that’s sitting on some net unrealized gain right now.

The metric works by going through the transaction history of each token in circulation to see what price it was last transferred or sold at. If this previous transaction price was less than the latest spot price for any token, then it may be considered to be currently sitting on some profit.

The Percent Supply in Profit adds up all coins of this type and determines what percentage of the supply they make up. Another indicator called the Percent Supply in Loss tracks the tokens of the opposite type. If one of these indicators is known, the other can simply be calculated by subtracting it from 100, since the total BTC supply must add up to 100%.

Now, here is the chart shared by Glassnode that shows the trend in the Bitcoin Percent Supply in Profit over the last few years:
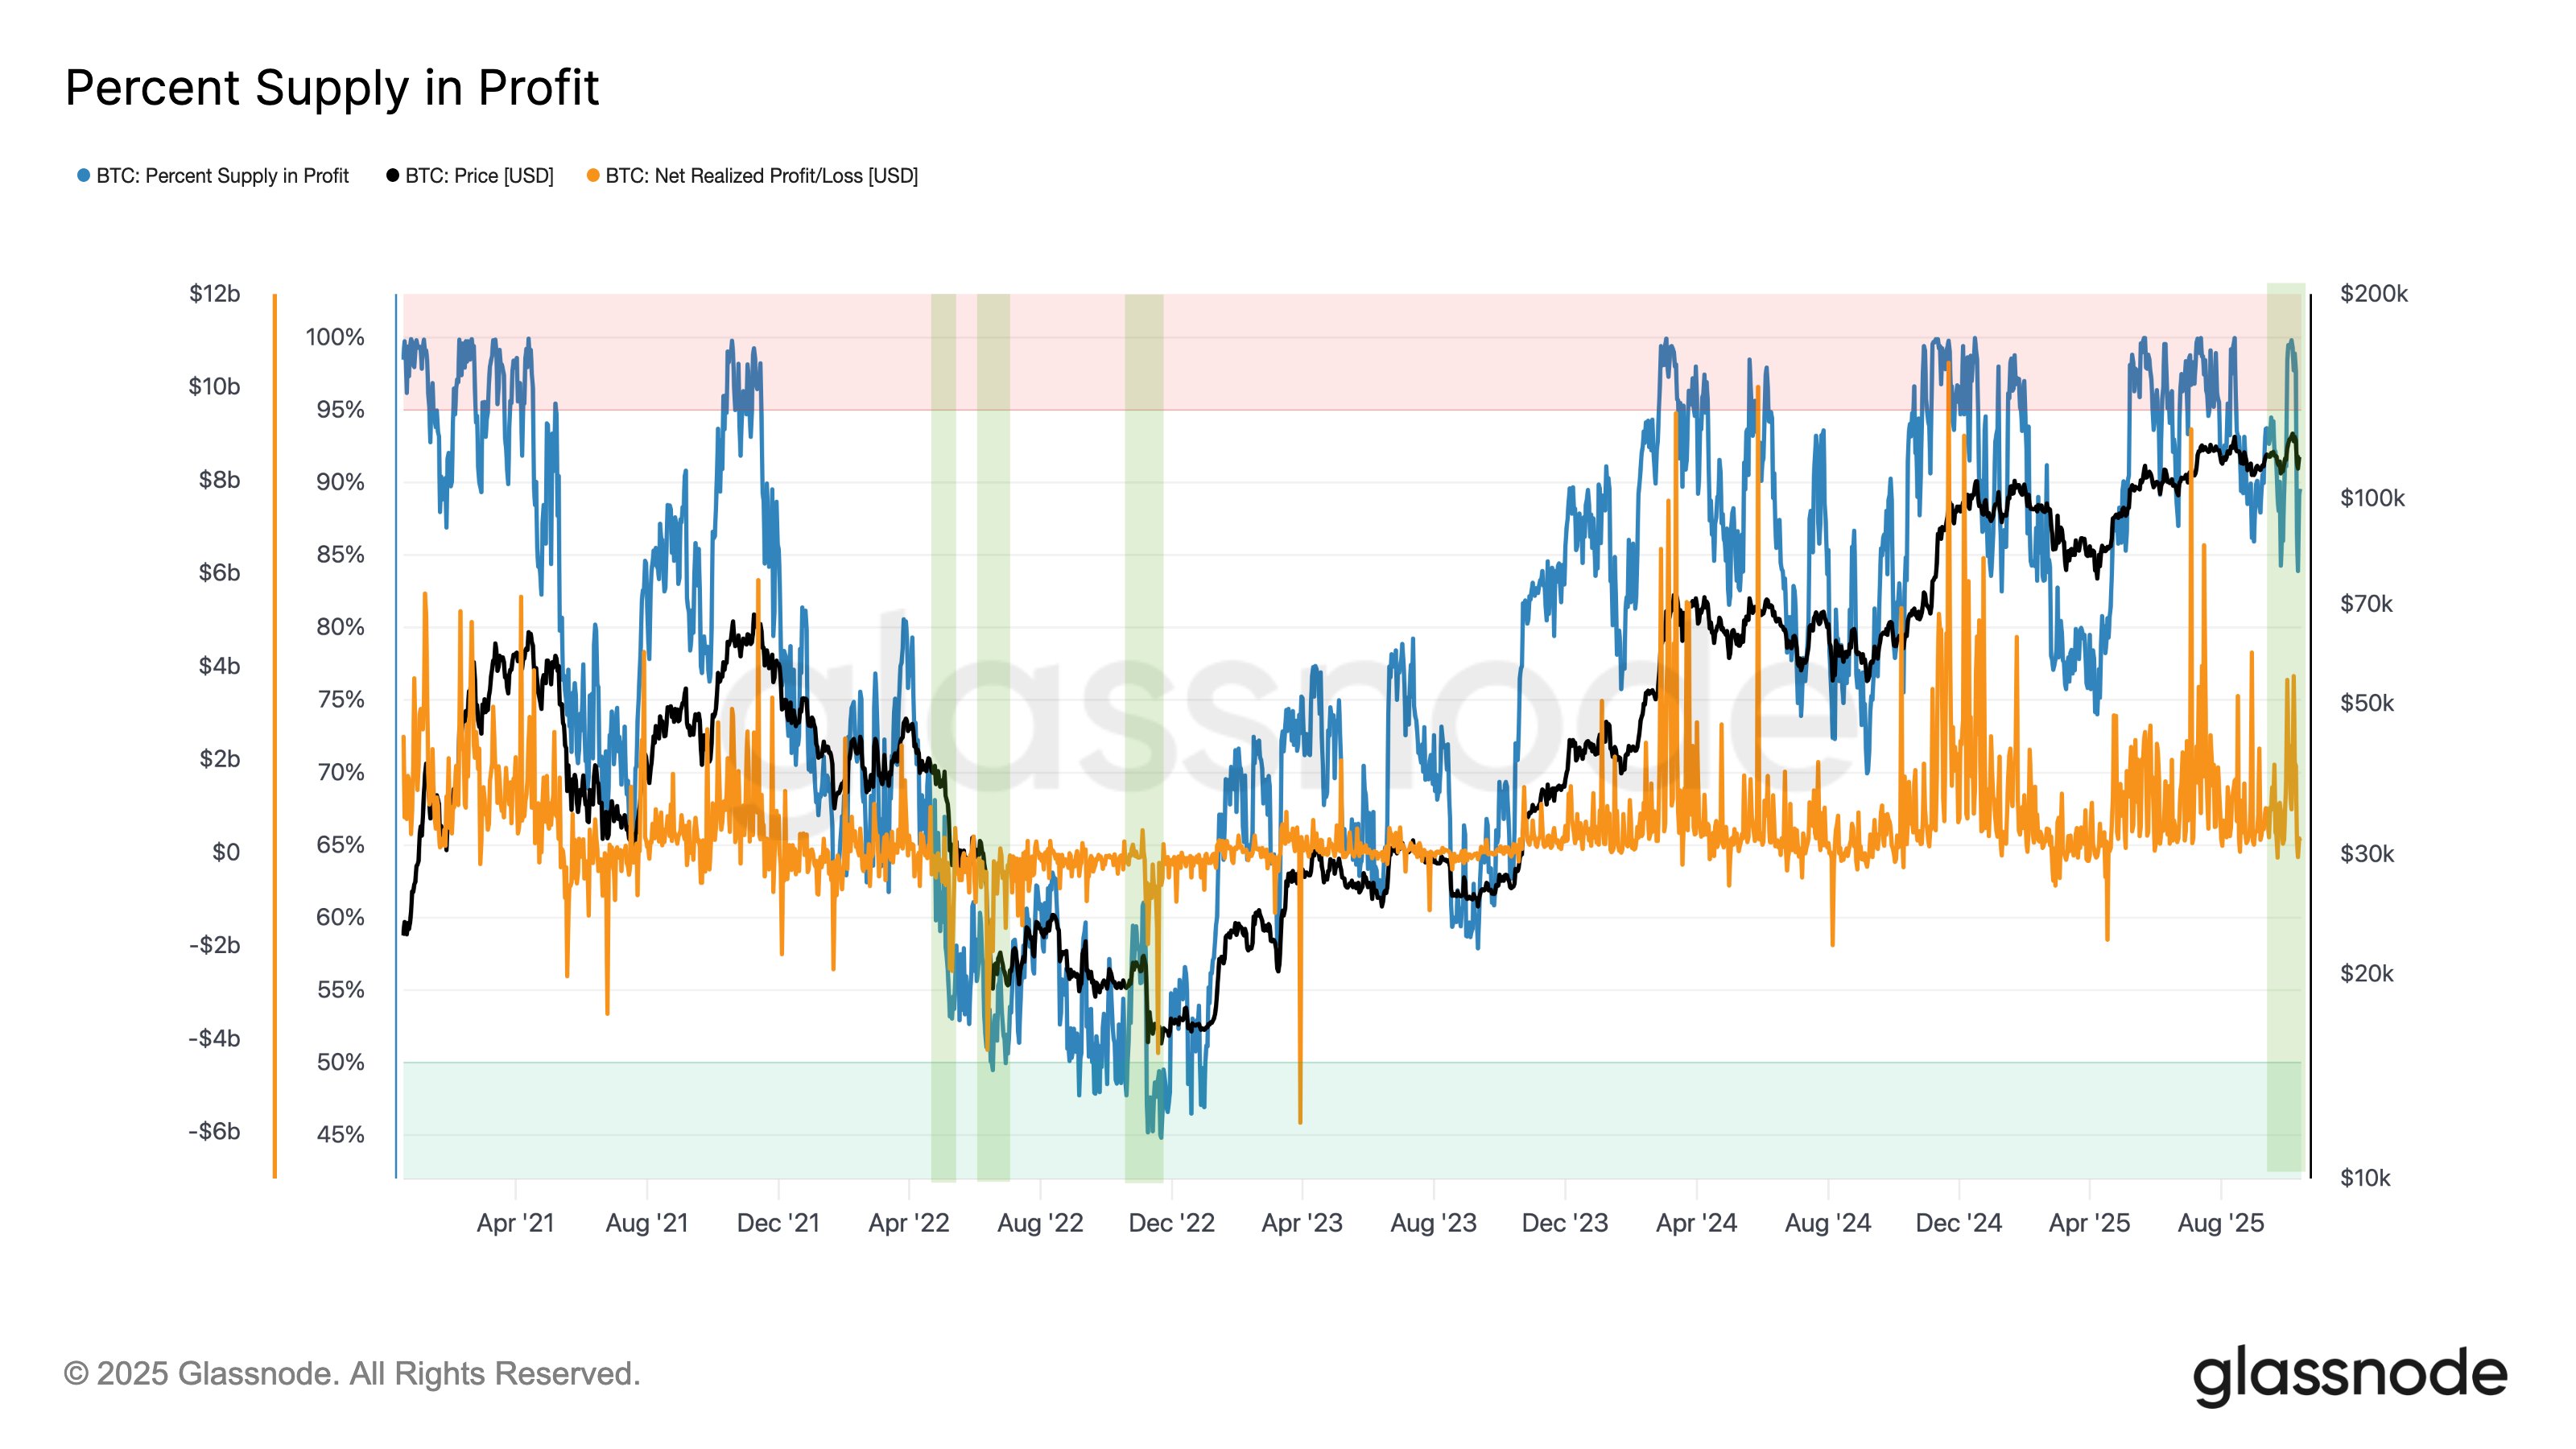
Bitcoin Percent Supply in Profit

As is visible in the above graph, the Bitcoin Percent Supply in Profit hit the 100% mark earlier in the month when the cryptocurrency’s price set its new all-time high (ATH). When the sharp selloff at the end of last week started, the indicator’s value was still well over the 90% mark, meaning the vast majority of investors were in the green. As such, the crash was more profit-driven, with losses mostly coming from the top buyers.

During some of the big crashes of the 2022 bear market, however, the market conditions were quite different. In the LUNA and FTX collapses, the Percent Supply in Profit sat under 65%.

In the chart, Glassnode has also highlighted the data of another metric: the Net Realized Profit/Loss, measuring whether profit-taking or loss-taking is dominant on the BTC network. From this indicator, it’s apparent that the aforementioned crashes saw deep negative values, implying a broad capitulation event took place.

The 3AC collapse occurred alongside a higher Percent Supply in Profit, but it also witnessed a notable spike in loss-taking. Based on this, Glassnode concludes that the latest Bitcoin crash was “a structurally different, leverage-driven event.”

BTC Price

At the time of writing, Bitcoin is trading around $110,400, down more than 11% over the last week.

Bitcoin Price Chart
Disclaimer: The articles reposted on this site are sourced from public platforms and are provided for informational purposes only. They do not necessarily reflect the views of MEXC. All rights remain with the original authors. If you believe any content infringes on third-party rights, please contact service@support.mexc.com for removal. MEXC makes no guarantees regarding the accuracy, completeness, or timeliness of the content and is not responsible for any actions taken based on the information provided. The content does not constitute financial, legal, or other professional advice, nor should it be considered a recommendation or endorsement by MEXC.
Share Insights

You May Also Like

The Beijing Procuratorate announced a case of illegal USDT cross-border foreign exchange transactions involving over 1.1 billion yuan.

The Beijing Procuratorate announced a case of illegal USDT cross-border foreign exchange transactions involving over 1.1 billion yuan.

PANews reported on October 29th that, according to a report by 21st Century Business Herald, on October 28th, the Beijing Municipal People's Procuratorate released "Typical Cases of High-Quality and Efficient Performance of Financial Procuratorial Duties" (2024-2025). One case involved "using virtual currency to indirectly buy and sell foreign exchange, involving over 1.1 billion yuan." Between January and August 2023, Lin Jia, under the instruction of others, colluded with Lin Yi, Xia, Bao, and Chen to use multiple bank cards under their names to receive large amounts of RMB funds transferred from clients (such as Liu) connected to the "upstream" of an illegal currency exchange organization. This gang used virtual currency as a "bridge" to achieve the illegal purpose of cross-border fund transfers: Lin Jia and others converted the received RMB into USDT through multiple USDT trading platform accounts they actually controlled, and then completed the cross-border fund transfer through platform transactions, essentially engaging in disguised foreign exchange trading and profiting from it. According to the report, the total illegal business activities of the gang amounted to over 1.182 billion yuan, of which five members, including Xia and Bao, participated in activities ranging from over 149 million yuan to over 469 million yuan. On March 21, 2025, the Haidian District People's Court of Beijing issued a first-instance verdict, sentencing all five defendants to prison terms ranging from two to four years for the crime of illegal business operations, and imposing corresponding fines.
Share
2025/10/29 09:42