

Solana Air Gap: Analyst Says No Major Support Level Until $24
An analyst has pointed out how a sort of supply “air gap” exists for Solana below $144, with no major on-chain support levels until much lower.
Solana URPD Reveals Supply Chasm Below $144
In a new post on X, analyst Ali Martinez has talked about how Solana support is looking from an on-chain lens. In on-chain analysis, the potential of any price level to act as support or resistance lies in the amount of coins that investors last purchased at it.
The reasoning behind this is that holders look at their cost basis as a special level and are sensitive to retests of it. The more holders that have their cost basis at a particular level, the larger the reaction from a retest could theoretically be.
As for what the nature of this reaction is likely to be, it comes down to the direction of the retest, as well as the mood in the market. When the retest occurs from above, holders might decide to accumulate more, thinking that the decline is a temporary dip and they would return in profit again.
Retests of major supply levels from above can, for this reason, provide support to the cryptocurrency. Similarly, retests in the opposite direction may be met with resistance, as holders panic exit at their break-even level, fearing going underwater again.
To showcase how the supply cost basis distribution on the Solana network is like right now, Martinez has shared the data of the UTXO Realized Price Distribution (URPD) from Glassnode.

As is visible in the above graph, the largest Solana supply zones on this indicator are all located above $144. Below this level, the cryptocurrency has relatively thin clusters. “There’s barely any meaningful demand until $24,” noted the analyst.
SOL has already started slipping under the last major support level of $144, so it only remains to be seen how the cryptocurrency will develop in the near future, considering the lack of any meaningful on-chain support cushions.
In a separate X post, Martinez has also shared the URPD data for Bitcoin. Unlike Solana, the number one cryptocurrency’s supply distribution is more even, meaning the asset has levels to rely on below the current range.
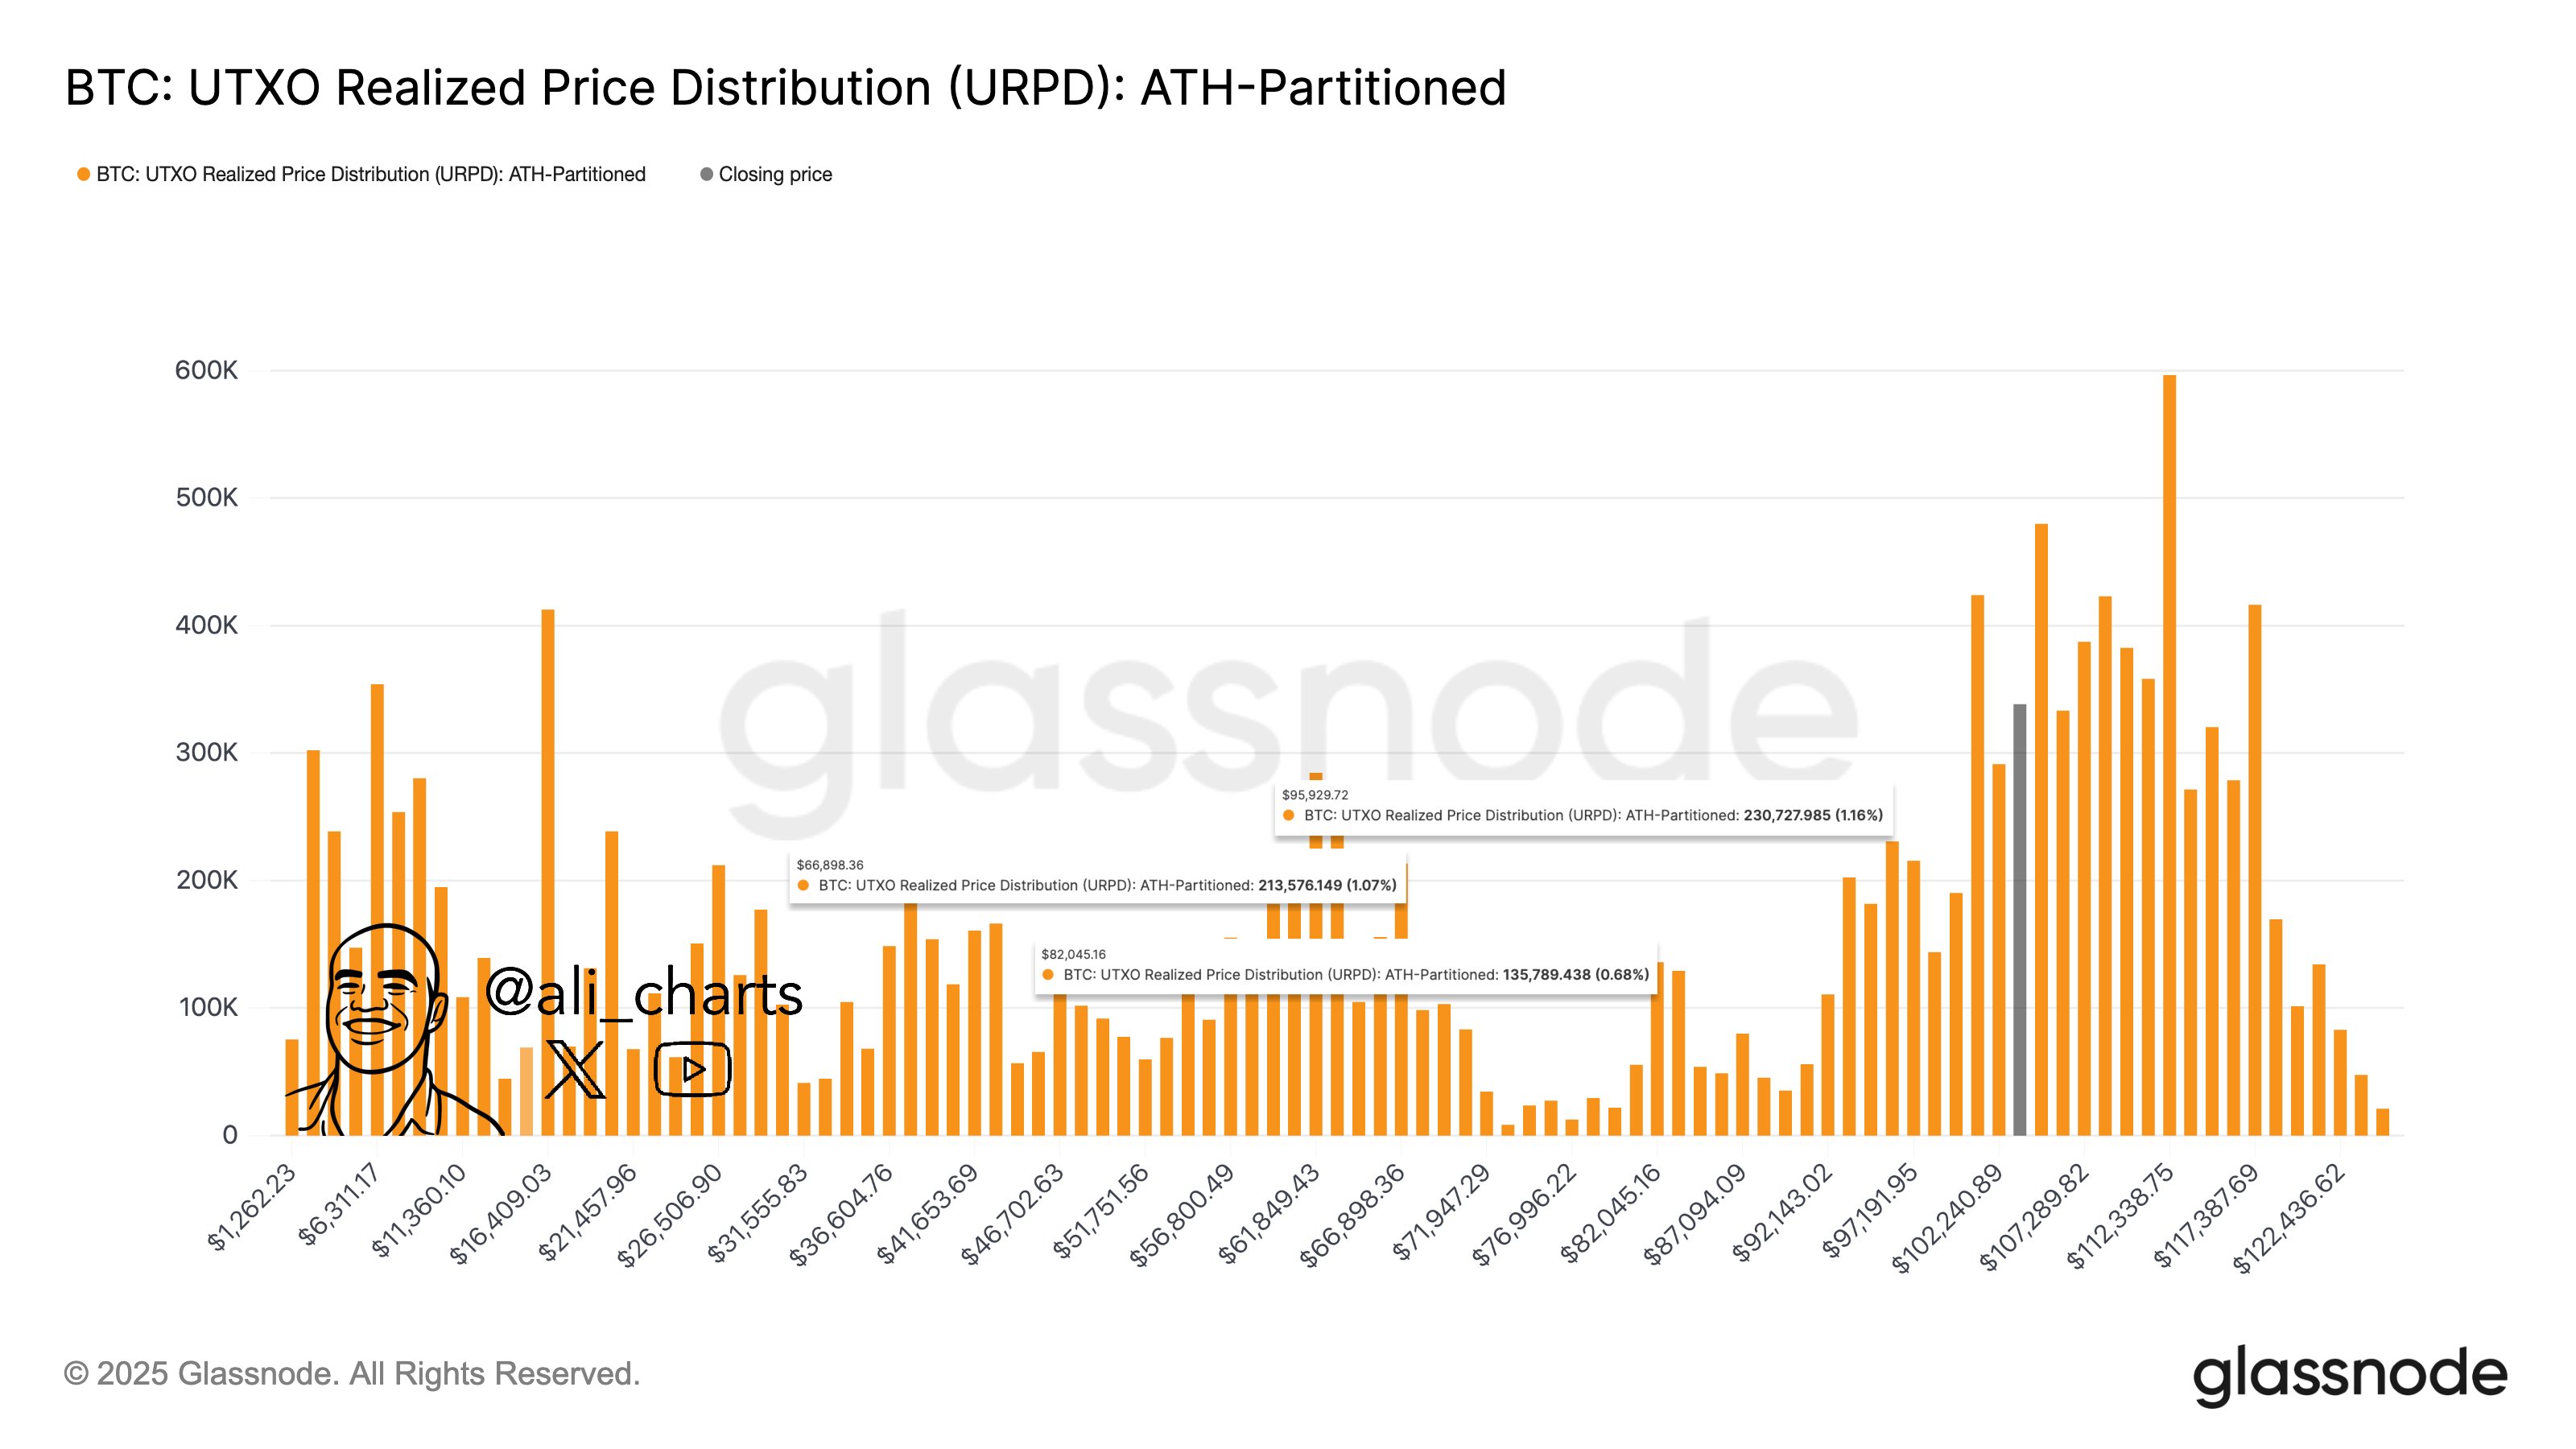
In particular, $82,000 and $67,000 are two levels below $95,000 that hold the cost basis of a significant amount of supply, and thus, could potentially be support barriers on the way down.
SOL Price
Solana dropped to $135 during its latest plunge, but the coin has since recovered back to $141.
You May Also Like

How Many Victims Did Serial Killer Ed Gein Have—And Did He Kill His Brother Henry?


Markets await Fed’s first 2025 cut, experts bet “this bull market is not even close to over”
