

Aster price weakness persists at $1.00, raising risk of another capitulation
Aster price remains under pressure near the $1 level as persistent weakness below key technical zones increases the probability of another capitulation move toward $0.89.
- Price remains below $1.00 value area low and key resistance.
- Bearish parabola structure signals possible capitulation.
- Reclaiming $1.00 could negate downside and trigger rally toward $1.20.
Aster’s (ASTER) price continues to exhibit clear weakness, with the market struggling to reclaim the $1.00 mark after losing key structural levels. The asset has now confirmed multiple daily closes below the value area low, turning a once-strong support zone into resistance.
Despite Aster’s TVL climbing to $2.15B as XYZVerse launches its $5.5M CS2 league, the shift in market structure reinforces the ongoing bearish trend, putting the next major support at $0.89 in focus.
Aster price key technical points
- Weakness Below $1.00: Price action remains below the value area low and high-timeframe resistance.
- Bearish Structure: Consecutive lower highs and lower lows confirm a sustained downtrend.
- Next Support Target: $0.89 stands as the next critical swing low and possible capitulation zone.
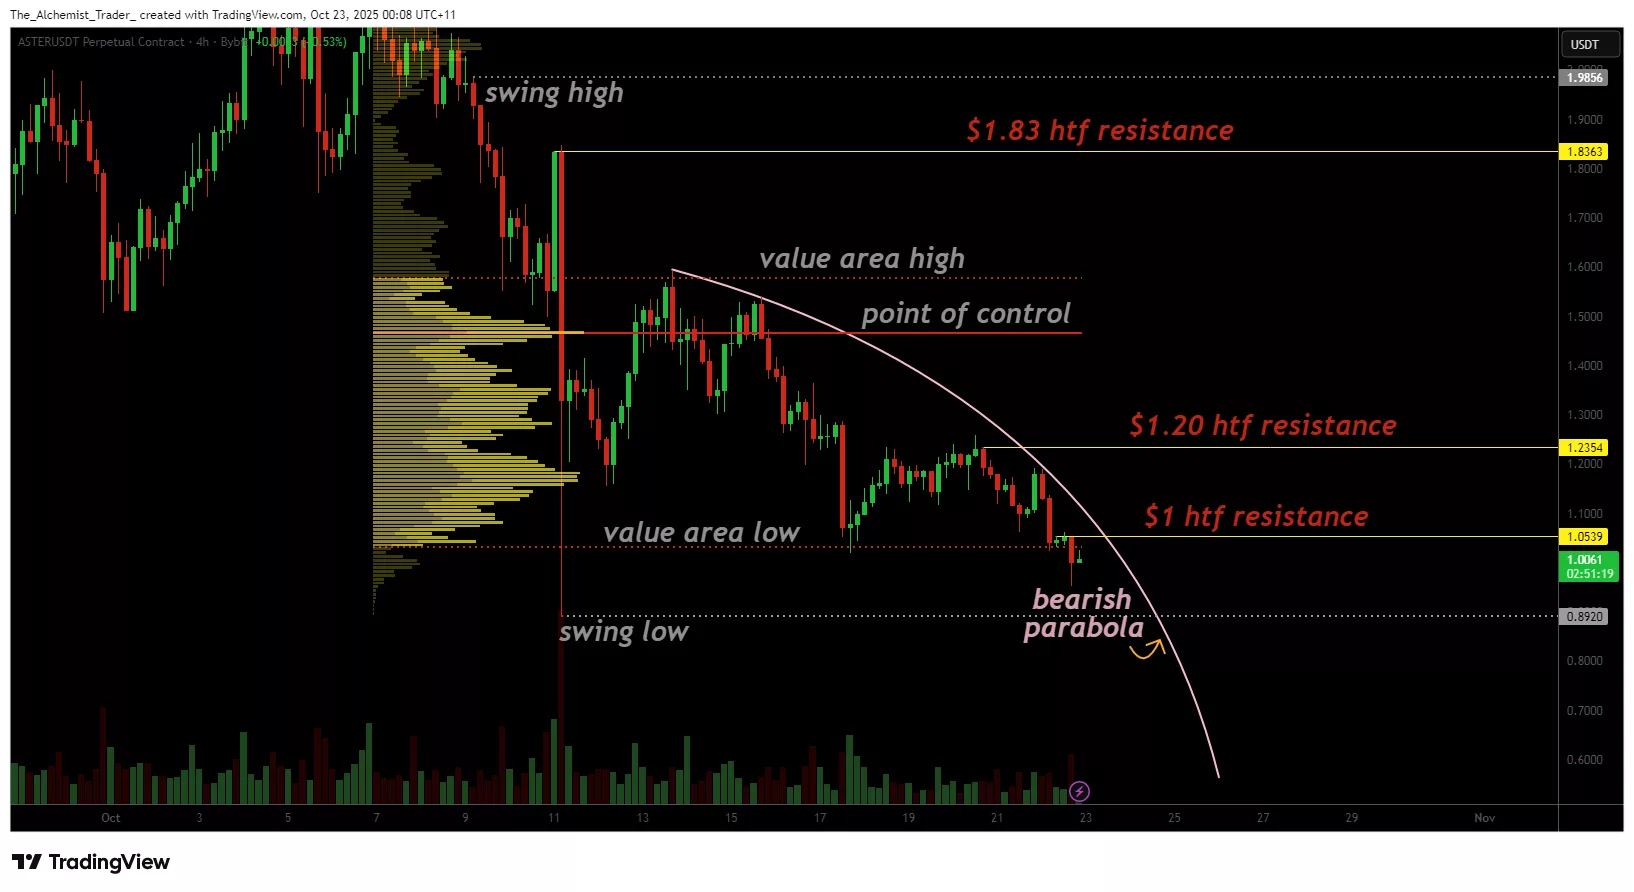
Aster’s current market structure is dominated by bearish momentum, with the $1.00 level acting as a key inflection point. In recent sessions, the price has consistently failed to close above this mark, confirming it as resistance. The value area low, previously an area of high trading volume, has now flipped into resistance as multiple daily candles closed beneath it.
This loss of structural support indicates that market sentiment remains cautious, and without a decisive reclaim of $1.00, downside continuation appears increasingly likely. The next logical technical target lies around $0.89, corresponding with the last swing low established during the prior corrective phase.
Additionally, the broader market structure is now forming what resembles a bearish inverse parabola, a setup that often precedes accelerated downside movements or capitulation events. This formation reflects the compounding weakness in price action, where failed bounces and weak recoveries add downward pressure over time.
From a market structure perspective, Aster’s current trajectory remains decisively bearish. The repeated inability to reclaim the $1.00 mark signals a lack of buyer conviction, with sellers maintaining control over short-term momentum. For sentiment to shift meaningfully, the price must reclaim and hold above this level on a daily closing basis.
The presence of consecutive lower lows reinforces this outlook, confirming that Aster is trading in a declining structure. A break below $0.89 would further accelerate downside momentum, possibly triggering a capitulation phase before any sustainable recovery can begin.
What to expect in the coming price action
Unless Aster reclaims the $1.00 resistance level, the bearish trend is expected to persist. A move below $0.89 would likely confirm a capitulation event, completing the inverse parabola pattern and potentially setting the stage for a midterm bottom after the move.


Ayrıca Şunları da Beğenebilirsiniz

XRP Confirms Monthly Trend Shift vs. Bitcoin: Why 41% Drop Is Now Base Case

US stocks slide as Trump calls for war escalation


