The post Why Bitcoin’s Current Compression and Macro Backdrop Point to a High-Timeframe Breakout appeared first on Coinpedia Fintech News After the latest drop,The post Why Bitcoin’s Current Compression and Macro Backdrop Point to a High-Timeframe Breakout appeared first on Coinpedia Fintech News After the latest drop,

Why Bitcoin’s Current Compression and Macro Backdrop Point to a High-Timeframe Breakout

Bitcoin price prediction 2025

The post Why Bitcoin’s Current Compression and Macro Backdrop Point to a High-Timeframe Breakout appeared first on Coinpedia Fintech News

After the latest drop, Bitcoin price consolidates around $87,000, within a narrow range that is now pressing against multi-week resistance. The star token usually accumulates before undergoing the next price action, and hence, the ongoing price compression is believed to transform into a gigantic breakout. While the macro narrative has soured and unemployment is rising, with liquidity expectations shifting, several high-timeframe technical signals are tightening. Historically, this type of macro-technical overlap has preceded a decisive BTC breakout. 

BTC Price Consolidating Within a Critical Zone

The BTC price lost the pivotal support zone around $88,600 during the recent pullback and has been compressing below the key resistance since then. The price is forming a sequence of higher lows below the range of $87,500 and $88,300, while volatility bleeds out. This type of squeeze historically revolves in the direction of the primary trend, still firmly upward. 

bitcoin price

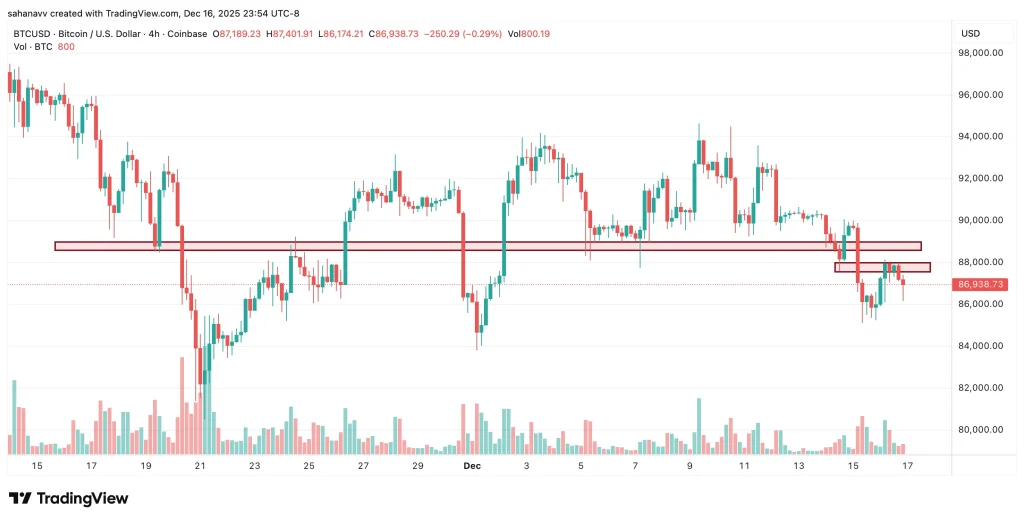
Observing the above chart, it would be clear that breaking the newly formed resistance zone between $87,500 and $88,000 is essential to open the doors beyond $90,000. However, it could further test yet another important barrier at $89,000, which has been a strong trend reversal zone since the start of the month. Therefore, a close above $88,500 to $89,000 would open the path to $90,000 to $92,000 based on previous liquidity pockets and untested price inefficiencies. 

On-Chain Positioning Points Toward Accumulation, Not Exhaustion

On-chain data continues to signal strength beneath Bitcoin’s price action. While BTC trades just below major resistance, wallet behaviour, long-term holder supply, and derivative positioning all indicate steady accumulation rather than distribution. Futures open interest is elevated around ~$60 billion (not collapsing), while funding rates remain neutral—suggesting traders aren’t panicking out of longs.

bitcoin price

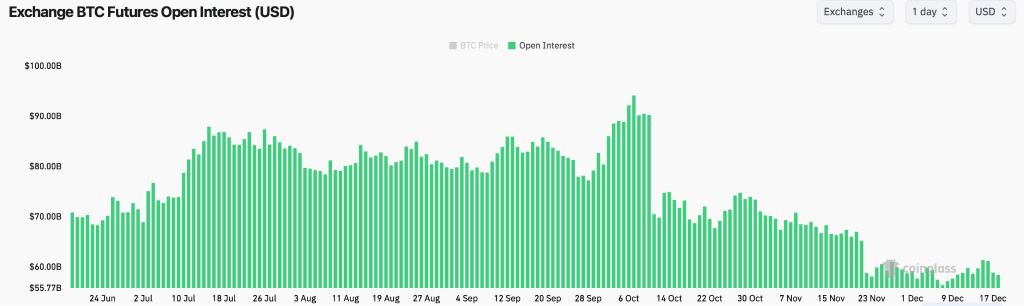
Bitcoin’s futures open interest has stayed elevated rather than crashing, indicating steady engagement rather than forced deleveraging—a common sign of capitulation. Funding rates have hovered near neutral, reflecting balanced leverage rather than extreme short-term blow-offs. Collectively, this pattern aligns with accumulation behaviour on-chain, not exhaustion.

The Bottom Line-What’s Next for the Bitcoin Price Rally?

Bitcoin’s tightening price structure is forming against a macro backdrop that is quietly becoming more supportive. Rising unemployment has historically increased expectations of liquidity support, and while policy shifts are not immediate, risk assets tend to move ahead of them. Importantly, this is occurring while leverage remains controlled, ETF flows have stabilised, and on-chain data shows little evidence of broad distribution.

From here, the market has two clear paths. A decisive break above $88,300 would likely trigger a liquidity-driven expansion toward $90,000–$92,000, confirming that the current compression has resolved higher. A rejection, on the other hand, could sweep support near $85,600, but unless $84,300 breaks on a daily close, such a move would resemble a reset rather than a trend reversal.

Market Opportunity
WHY Logo
WHY Price(WHY)
$0,00000001529
$0,00000001529$0,00000001529
0,00%
USD
WHY (WHY) Live Price Chart
Disclaimer: The articles reposted on this site are sourced from public platforms and are provided for informational purposes only. They do not necessarily reflect the views of MEXC. All rights remain with the original authors. If you believe any content infringes on third-party rights, please contact service@support.mexc.com for removal. MEXC makes no guarantees regarding the accuracy, completeness, or timeliness of the content and is not responsible for any actions taken based on the information provided. The content does not constitute financial, legal, or other professional advice, nor should it be considered a recommendation or endorsement by MEXC.

You May Also Like

Whales Dump 200 Million XRP in Just 2 Weeks – Is XRP’s Price on the Verge of Collapse?

Whales Dump 200 Million XRP in Just 2 Weeks – Is XRP’s Price on the Verge of Collapse?

Whales offload 200 million XRP leaving market uncertainty behind. XRP faces potential collapse as whales drive major price shifts. Is XRP’s future in danger after massive sell-off by whales? XRP’s price has been under intense pressure recently as whales reportedly offloaded a staggering 200 million XRP over the past two weeks. This massive sell-off has raised alarms across the cryptocurrency community, as many wonder if the market is on the brink of collapse or just undergoing a temporary correction. According to crypto analyst Ali (@ali_charts), this surge in whale activity correlates directly with the price fluctuations seen in the past few weeks. XRP experienced a sharp spike in late July and early August, but the price quickly reversed as whales began to sell their holdings in large quantities. The increased volume during this period highlights the intensity of the sell-off, leaving many traders to question the future of XRP’s value. Whales have offloaded around 200 million $XRP in the last two weeks! pic.twitter.com/MiSQPpDwZM — Ali (@ali_charts) September 17, 2025 Also Read: Shiba Inu’s Price Is at a Tipping Point: Will It Break or Crash Soon? Can XRP Recover or Is a Bigger Decline Ahead? As the market absorbs the effects of the whale offload, technical indicators suggest that XRP may be facing a period of consolidation. The Relative Strength Index (RSI), currently sitting at 53.05, signals a neutral market stance, indicating that XRP could move in either direction. This leaves traders uncertain whether the XRP will break above its current resistance levels or continue to fall as more whales sell off their holdings. Source: Tradingview Additionally, the Bollinger Bands, suggest that XRP is nearing the upper limits of its range. This often points to a potential slowdown or pullback in price, further raising concerns about the future direction of the XRP. With the price currently around $3.02, many are questioning whether XRP can regain its footing or if it will continue to decline. The Aftermath of Whale Activity: Is XRP’s Future in Danger? Despite the large sell-off, XRP is not yet showing signs of total collapse. However, the market remains fragile, and the price is likely to remain volatile in the coming days. With whales continuing to influence price movements, many investors are watching closely to see if this trend will reverse or intensify. The coming weeks will be critical for determining whether XRP can stabilize or face further declines. The combination of whale offloading and technical indicators suggest that XRP’s price is at a crossroads. Traders and investors alike are waiting for clear signals to determine if the XRP will bounce back or continue its downward trajectory. Also Read: Metaplanet’s Bold Move: $15M U.S. Subsidiary to Supercharge Bitcoin Strategy The post Whales Dump 200 Million XRP in Just 2 Weeks – Is XRP’s Price on the Verge of Collapse? appeared first on 36Crypto.
Share
Coinstats2025/09/17 23:42
Fidelity Ethereum ETF purchases 34,740 Ethereum worth $159.4M

Fidelity Ethereum ETF purchases 34,740 Ethereum worth $159.4M

The post Fidelity Ethereum ETF purchases 34,740 Ethereum worth $159.4M appeared on BitcoinEthereumNews.com. Key Takeaways Fidelity Investments purchased 34,740 ETH (~$159.4M) for its spot Ethereum ETF. Institutional demand for Ethereum exposure via regulated investment vehicles remains strong. Fidelity Investments, a major U.S. asset management firm, purchased 34,740 Ethereum tokens valued at $159.4 million for its spot ETF on Thursday. The acquisition reflects continued institutional demand for Ethereum exposure through regulated investment products. Spot Ethereum ETFs launched in mid-2024 following regulatory approval. Ethereum ETFs saw cumulative inflows exceeding $1 billion in their first few months after launch in 2024, reflecting growing mainstream acceptance of digital assets among institutional investors. Fidelity has reported consistent Ethereum purchases for its ETF throughout 2025, with acquisitions ranging from tens to hundreds of millions in value. Source: https://cryptobriefing.com/fidelity-spot-etf-purchases-ethereum-worth-159-4m/
Share
BitcoinEthereumNews2025/09/19 13:42
WBD board tells shareholders to reject Paramount Skydance takeover offer

WBD board tells shareholders to reject Paramount Skydance takeover offer

The post WBD board tells shareholders to reject Paramount Skydance takeover offer appeared on BitcoinEthereumNews.com. The Paramount logo is displayed on the water
Share
BitcoinEthereumNews2025/12/17 21:27