

Algorand price could run towards $1 if this happens
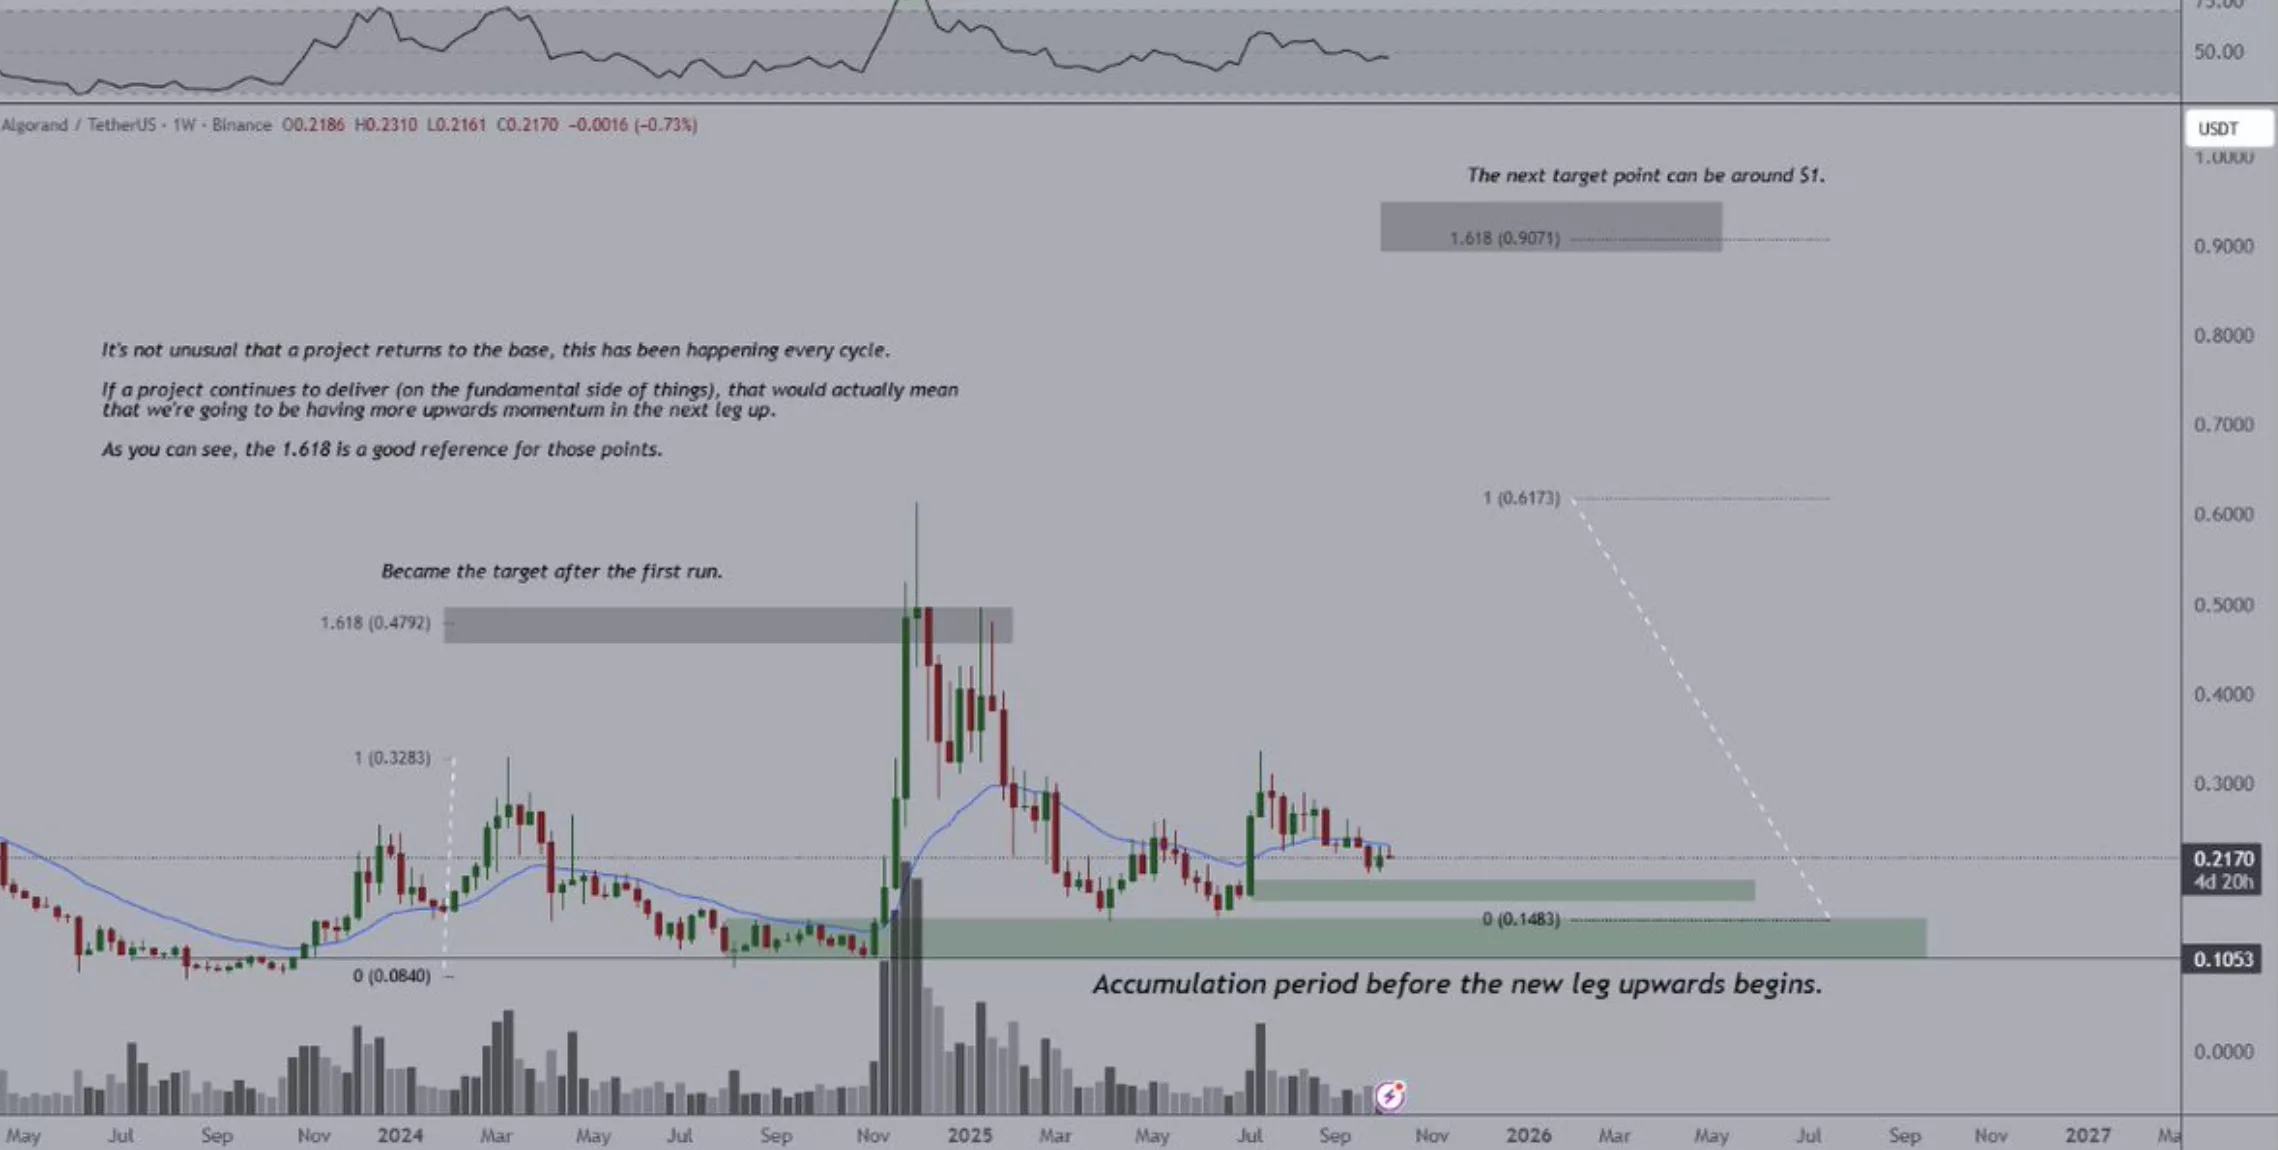
Algorand price may be approaching a trend reversal, with potential to rally toward $1 if it breaks above the 20-week MA on the weekly chart.
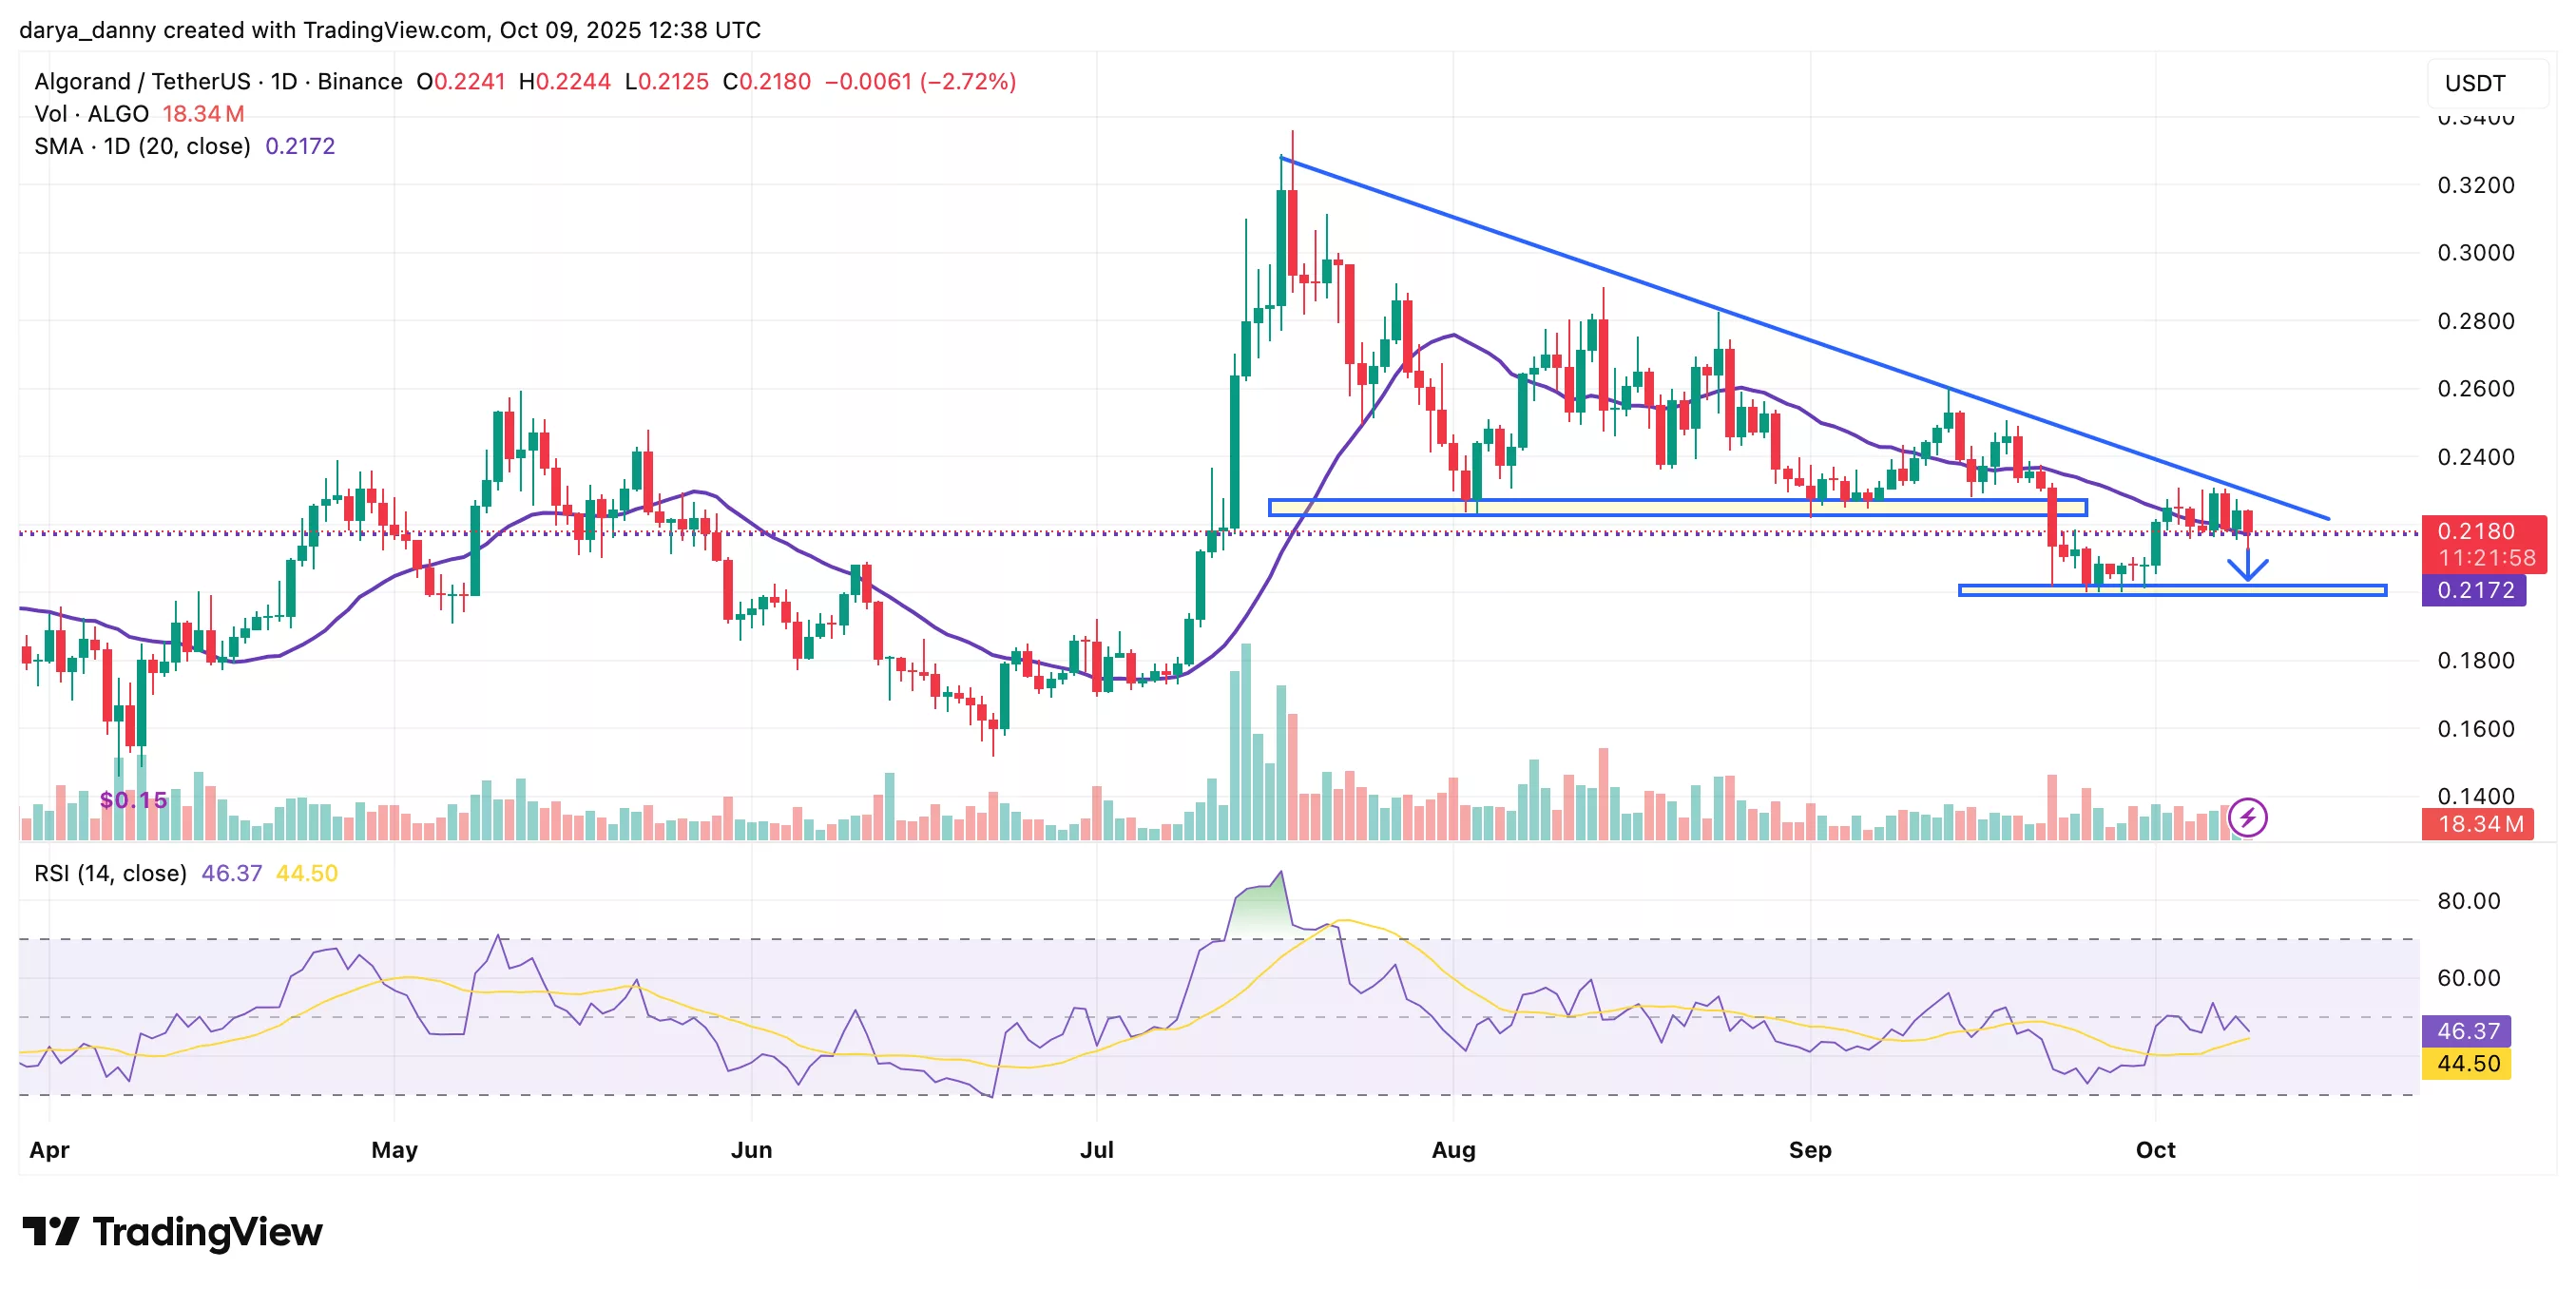
- Algorand price remains in a downtrend, recently dipping below key support at $0.22 before bouncing back.
- A potential double-bottom could form at $0.20, with a breakout above $0.23 possibly driving a move toward $0.26–$0.27.
- Analyst Michaël van de Poppe says that a weekly chart breakout above the 20-week MA could trigger a broader rally toward $0.90–$1.00.
Algorand (ALGO) price continues to extend its downtrend, consistently forming lower highs. The price has recently broken horizontal support around $0.22, dipping to $0.20 where buyers stepped in to scoop the dip, driving the altcoin‘s price back up to retest the $0.22 zone.
However, RSI readings hover around 46, underscoring a neutral-to-bearish bias that leaves room for further downside. Another potential retest of the $0.20 level appears likely, as that area now serves as the new local support.
If this support zone is tested again, it could set up a potential double-bottom pattern, with the neckline forming around $0.23. A confirmed breakout above this neckline could trigger a measured move toward $0.26–$0.27, potentially signaling the start of a trend reversal to the upside.
Michaël van de Poppe: Algorand price could rally to $1
Zooming out to the weekly chart, Algorand price appears to be sliding toward its historical accumulation base, according to analyst Michaël van de Poppe. “It’s not unusual for a project to revisit its base — this tends to happen every cycle,” he wrote in a recent post on X.
van de Poppe suggests that a breakout above the 20-week moving average could signal a broader trend reversal for ALGO and potentially trigger a rally toward the $1 mark, in line with the 1.618 Fibonacci extension level near $0.90–$1.00.
You May Also Like

Why Is Pi Network Token (PI) Up 22% on Oct. 29?

German VDMA cautions U.S. tariff expansion will impact over 50% of machine exports

BNB Price Drops 2% as the Dex Volume Tumbles Cautioning Further Downside
Highlights: The BNB price is down 2% to $1111.46, despite the trading volume spiking 26%. The BNB on-chain demand has slipped, with the open interest plummeting 3% showing a drop in demand. The technical outlook shows a tight tug-of-war, with the bulls attempting to overcome resistance zones. The BNB price is down 2% today, to trade at $1111.46. Despite the plunge, the daily trading volume has soared 26% showing increased market activity among traders. However, BNB Chain has seen declining network activity, with the open interest plummeting, signaling a drop in demand. On Chain Demand on BNB Cools Off The BNB Chain is in a state of cooldown of network activity, which indicates low on-chain demand. In most instances, when a network fails to ensure large volumes or revenues, it means that there is low demand or outflows to other networks. BNB DeFi Data: DeFiLlama According to DeFiLlama data, the volume of the Decentralized Exchanges (DEXs) is down to at least $2.12 billion in comparison to the high of $6.313 billion on October 8, which also means low on-chain liquidity. On the other hand, Coinglass data shows that the volume of BNB has grown by 3.97% to reach $4.95 billion. However, the open interest in BNB futures has dropped by 3.36% to reach $1.74 billion. This reduction in open interest is an indication of a conservative stance by investors since the number of new positions being opened is low. This could be an indication that investors are not so sure about the short-term price outlook. BNB Derivatives Data: CoinGlass Meanwhile, the long-to-short ratio is sitting at 0.9091. This shows that the traders are undecided on BNB price’s next move, as it sits below 1. BNB Price Moves Into Consolidation The chart displays the BNB/USD price action on a 4-hour timeframe, with the token currently hovering around $1111.46. The 50-day Simple Moving Average (SMA) is at $1113, while the 200-day SMA sits at $1129, cushioning the bulls against upside movement. The price has mostly been trending below both SMAs, indicating that the bears are having the upper hand. The BNB trading volume is up, soaring 26%, signaling the momentum is real. On the 4-hour chart, BNB is trading within a consolidation channel. In such a case, this pattern may act as an accumulation period, giving the bulls hind wings to break above resistance zones. BNB/USD 4-hour chart: TradingView Zooming in, the Relative Strength Index (RSI) sits at 44.15, below the 50 level. This shows weakening momentum in the BNB market, and might lead to the RSI plunging to the oversold region if the bulls don’t regain control. In the short term, the BNB price could move up to $1113 resistance and flip it into support. A close above this zone will see the bulls target $1126 resistance, giving the bulls strength to reclaim the $1230 mark. Conversely, if the resistance zones prove too strong, a dip towards $1012 could be plausible. In such a case, this could be a prime buy zone for the risk-takers. In the long term, if the token keeps the hype alive, the bulls may reclaim the $1375 high or higher. eToro Platform Best Crypto Exchange Over 90 top cryptos to trade Regulated by top-tier entities User-friendly trading app 30+ million users 9.9 Visit eToro eToro is a multi-asset investment platform. The value of your investments may go up or down. Your capital is at risk. Don’t invest unless you’re prepared to lose all the money you invest. This is a high-risk investment, and you should not expect to be protected if something goes wrong.