

Pi Network Price Struggles as Market Indicators Point to Further Decline
TLDR
- PI’s ATR has dropped to 0.0234, indicating weak market momentum.
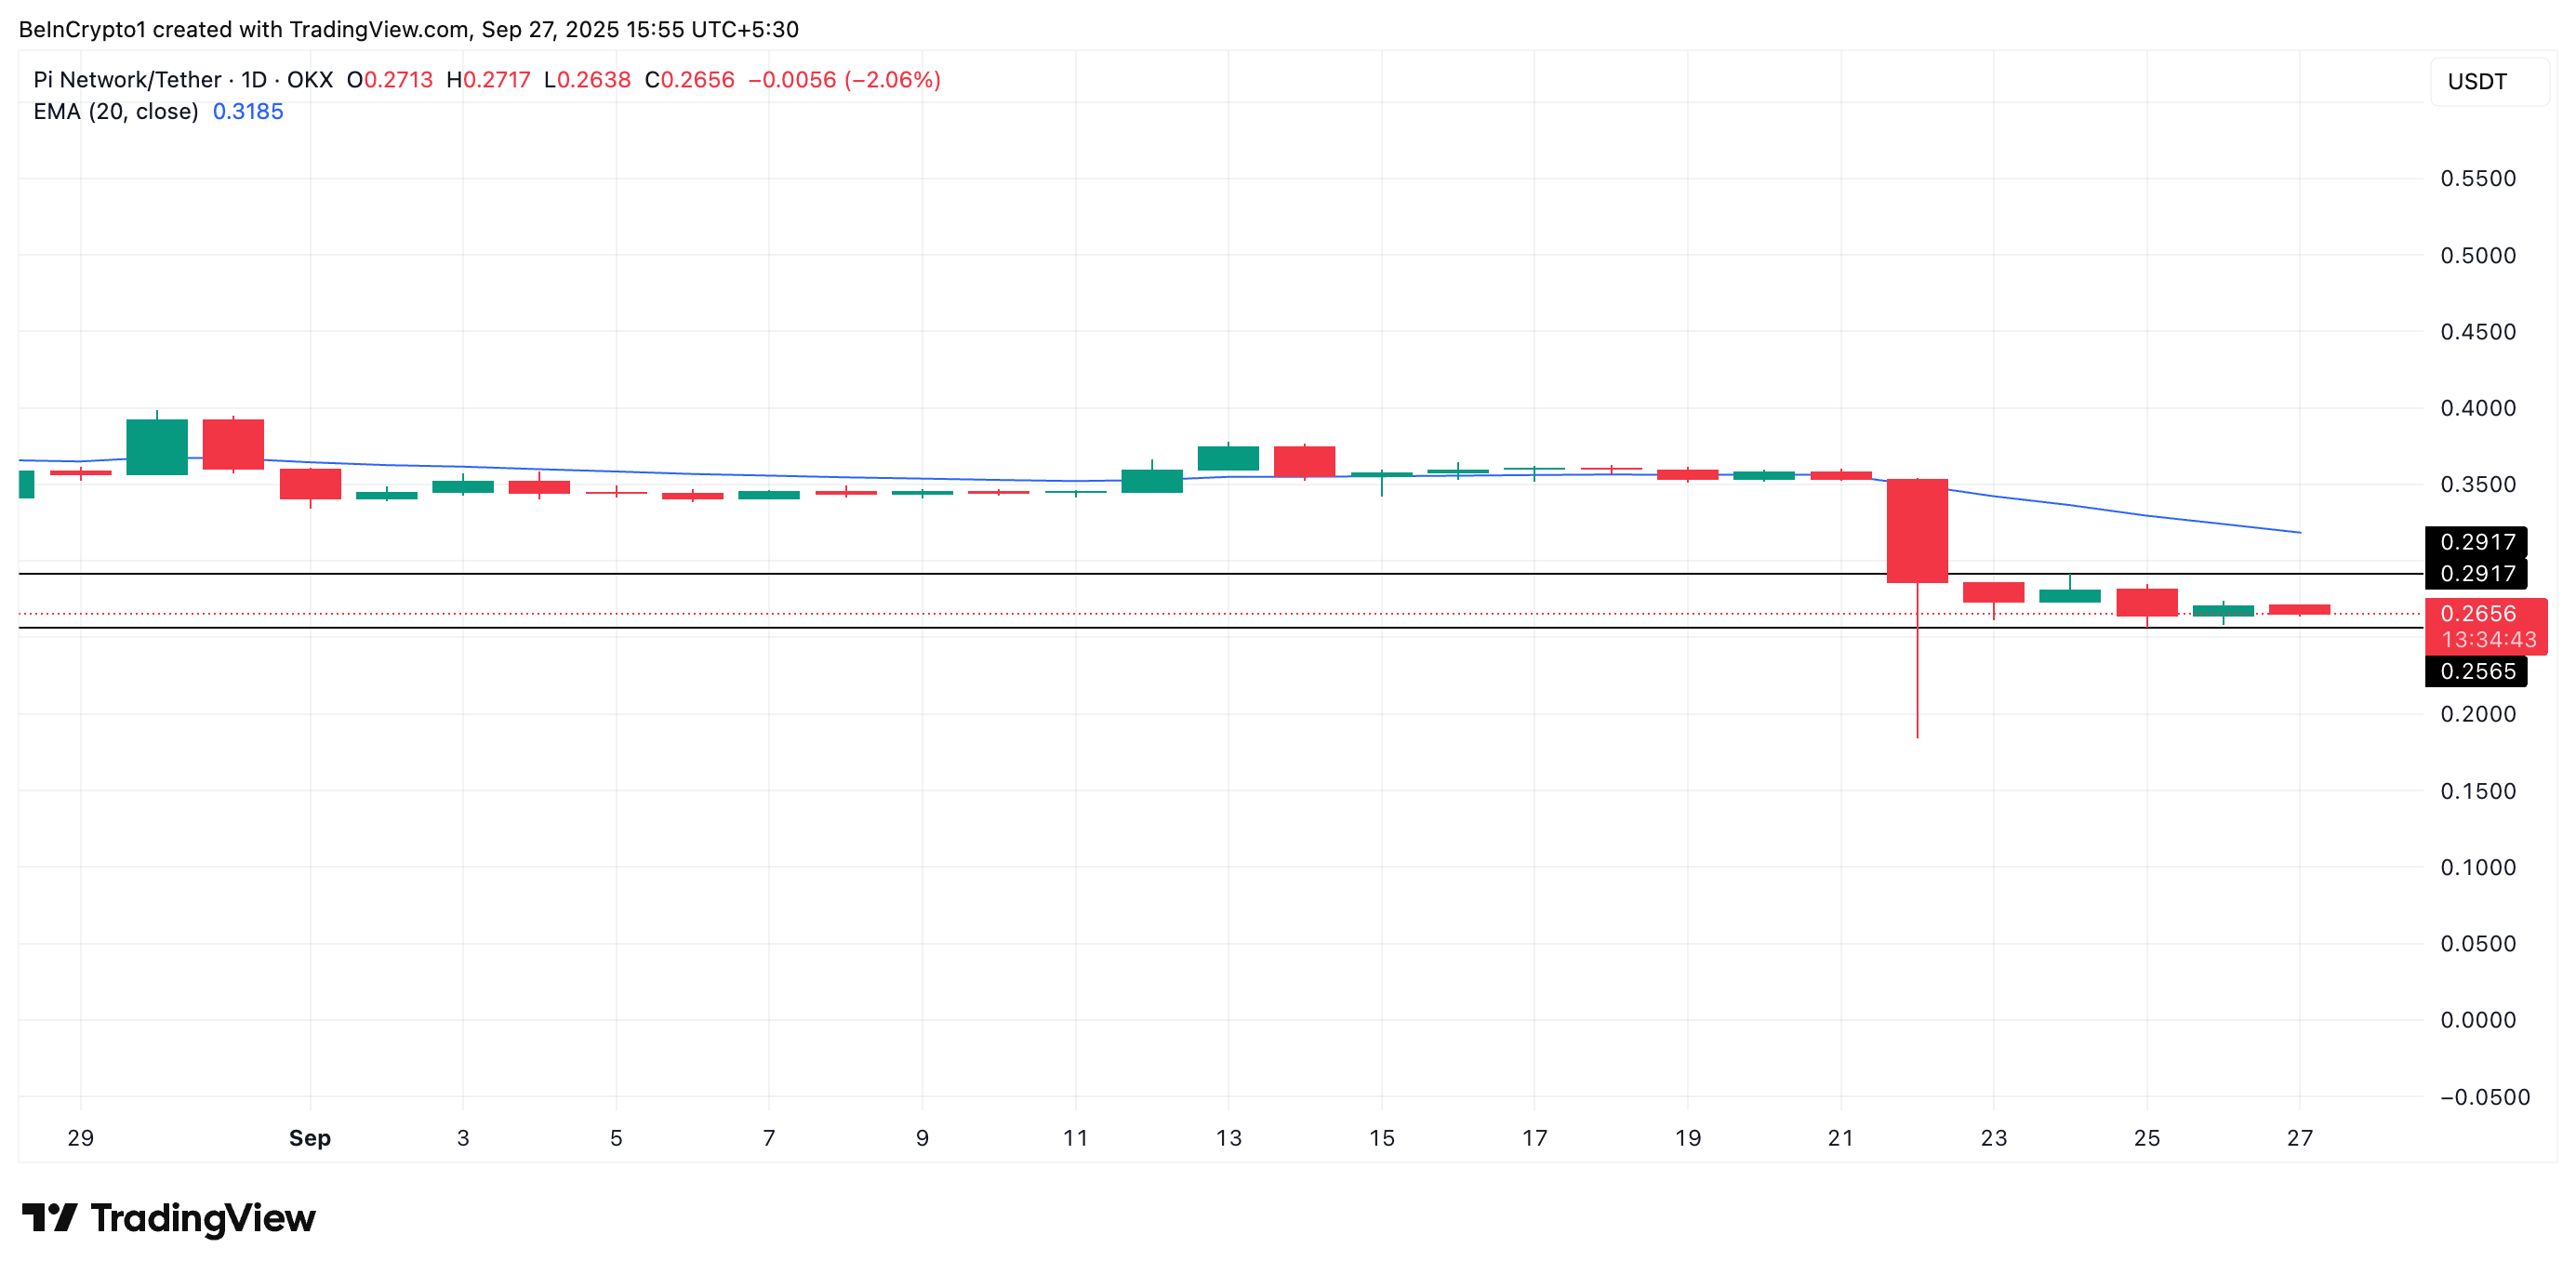
- Pi Network’s price remains below the 20-day EMA, showing bearish trends.
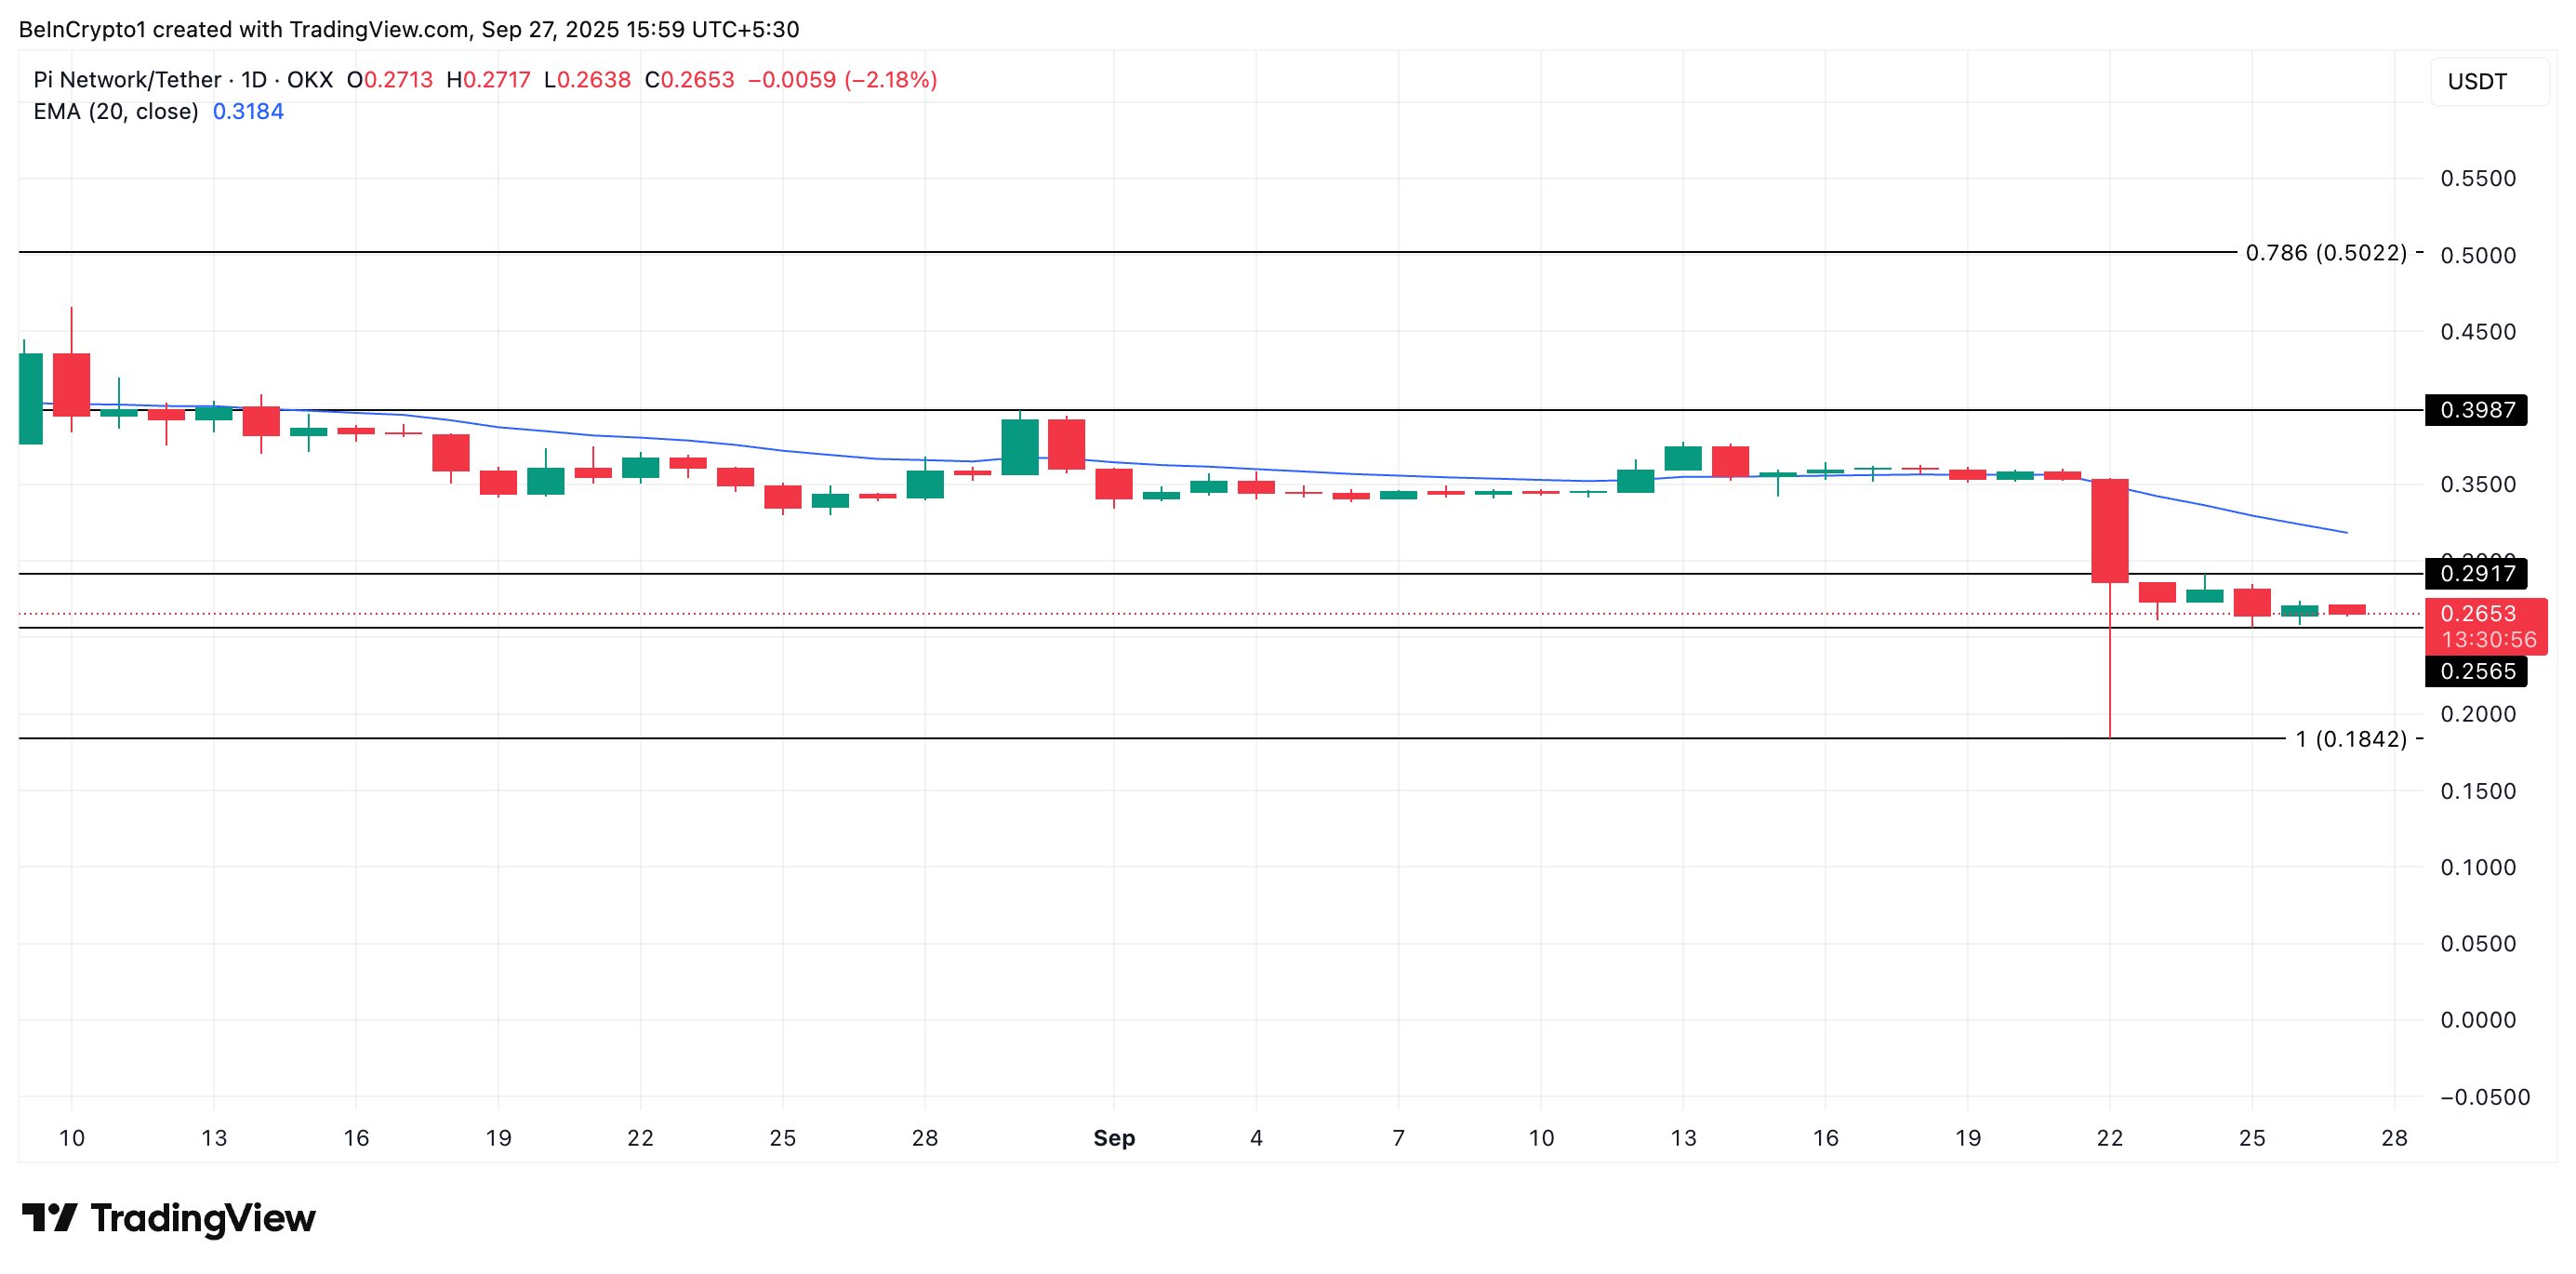
- Support at $0.2565 faces pressure, risking a drop back to the all-time low.
- PI struggles to break resistance at $0.2917, reinforcing downward sentiment.
Pi Network’s native token, PI, is facing troubling signs as its price continues to stagnate. Since hitting an all-time low of $0.1842 on September 22, PI has been trapped in a sideways trading pattern, oscillating between key support and resistance levels. Weakening momentum, reflected by several market indicators, raises concerns that the token could soon break below its current support, leading to another potential price drop.
Weak Momentum and Low Trader Participation
The current price action for PI highlights a decline in market activity. The token’s Average True Range (ATR), which measures price fluctuations, has steadily fallen to 0.0234. This suggests that the level of price movement is shrinking, which typically signals weakening trader participation.
With less market volatility, there is a reduction in both buying and selling pressure, pointing to a possible continuation of the sideways trend or even a breakdown below critical support levels.
The decrease in the ATR could indicate that traders are hesitant to engage with PI at its current price range. As fewer participants enter the market, the chances of the price sliding further down increase. If this trend persists, the support at $0.2565 could be tested, and if it fails to hold, PI may revisit its all-time low.
Struggling Below Key Resistance Levels
Another critical factor influencing PI’s outlook is its position relative to the 20-day Exponential Moving Average (EMA). This moving average is currently acting as a dynamic resistance point, sitting just above the token’s current price at $0.3185.
The 20-day EMA is a key indicator of short-term price trends. When the price is below this moving average, it suggests that sellers are in control, and there is a lack of upward momentum.

At the moment, PI has failed to break above this resistance, confirming that bearish sentiment is prevalent in the market. The token’s inability to climb above the 20-day EMA raises the likelihood of further downside pressure. Traders are showing little interest in pushing the price higher, which suggests the bearish trend is likely to persist unless there is a notable shift in market sentiment.
Risk of Breaking Support Levels
The combination of weak momentum and resistance at the 20-day EMA creates a concerning technical setup for PI. As the token trades closer to its support at $0.2565, there is a growing risk of a price breakdown.
If this support level fails to hold, PI could move towards its all-time low of $0.1842. This would mark another significant drop for the token, further solidifying the bearish outlook for the short-term future.
Given the current market conditions, PI seems vulnerable to more selling pressure. With dwindling participation and a lack of positive news or developments to boost sentiment, the risks of a further decline outweigh any potential for a short-term rally.
Potential for a Reversal
While the bearish outlook is dominant, there is still a possibility of a price reversal if market sentiment improves. A positive shift could allow PI to break through its resistance at $0.2917.
If this level is surpassed, the token could start to recover, potentially reclaiming the 20-day EMA and initiating a more sustained upward movement. However, this would require a significant change in market conditions or a catalyst that sparks renewed interest in the token.
In summary, PI is currently trapped in a sideways trend, with technical indicators pointing to further downside risk. Unless market sentiment changes, PI faces the possibility of breaking key support levels and revisiting its all-time low. The 20-day EMA will continue to act as a major resistance point, and without renewed demand, the outlook remains bearish.
The post Pi Network Price Struggles as Market Indicators Point to Further Decline appeared first on CoinCentral.
You May Also Like

Why Is Pi Network Token (PI) Up 22% on Oct. 29?

German VDMA cautions U.S. tariff expansion will impact over 50% of machine exports

BNB Price Drops 2% as the Dex Volume Tumbles Cautioning Further Downside
Highlights: The BNB price is down 2% to $1111.46, despite the trading volume spiking 26%. The BNB on-chain demand has slipped, with the open interest plummeting 3% showing a drop in demand. The technical outlook shows a tight tug-of-war, with the bulls attempting to overcome resistance zones. The BNB price is down 2% today, to trade at $1111.46. Despite the plunge, the daily trading volume has soared 26% showing increased market activity among traders. However, BNB Chain has seen declining network activity, with the open interest plummeting, signaling a drop in demand. On Chain Demand on BNB Cools Off The BNB Chain is in a state of cooldown of network activity, which indicates low on-chain demand. In most instances, when a network fails to ensure large volumes or revenues, it means that there is low demand or outflows to other networks. BNB DeFi Data: DeFiLlama According to DeFiLlama data, the volume of the Decentralized Exchanges (DEXs) is down to at least $2.12 billion in comparison to the high of $6.313 billion on October 8, which also means low on-chain liquidity. On the other hand, Coinglass data shows that the volume of BNB has grown by 3.97% to reach $4.95 billion. However, the open interest in BNB futures has dropped by 3.36% to reach $1.74 billion. This reduction in open interest is an indication of a conservative stance by investors since the number of new positions being opened is low. This could be an indication that investors are not so sure about the short-term price outlook. BNB Derivatives Data: CoinGlass Meanwhile, the long-to-short ratio is sitting at 0.9091. This shows that the traders are undecided on BNB price’s next move, as it sits below 1. BNB Price Moves Into Consolidation The chart displays the BNB/USD price action on a 4-hour timeframe, with the token currently hovering around $1111.46. The 50-day Simple Moving Average (SMA) is at $1113, while the 200-day SMA sits at $1129, cushioning the bulls against upside movement. The price has mostly been trending below both SMAs, indicating that the bears are having the upper hand. The BNB trading volume is up, soaring 26%, signaling the momentum is real. On the 4-hour chart, BNB is trading within a consolidation channel. In such a case, this pattern may act as an accumulation period, giving the bulls hind wings to break above resistance zones. BNB/USD 4-hour chart: TradingView Zooming in, the Relative Strength Index (RSI) sits at 44.15, below the 50 level. This shows weakening momentum in the BNB market, and might lead to the RSI plunging to the oversold region if the bulls don’t regain control. In the short term, the BNB price could move up to $1113 resistance and flip it into support. A close above this zone will see the bulls target $1126 resistance, giving the bulls strength to reclaim the $1230 mark. Conversely, if the resistance zones prove too strong, a dip towards $1012 could be plausible. In such a case, this could be a prime buy zone for the risk-takers. In the long term, if the token keeps the hype alive, the bulls may reclaim the $1375 high or higher. eToro Platform Best Crypto Exchange Over 90 top cryptos to trade Regulated by top-tier entities User-friendly trading app 30+ million users 9.9 Visit eToro eToro is a multi-asset investment platform. The value of your investments may go up or down. Your capital is at risk. Don’t invest unless you’re prepared to lose all the money you invest. This is a high-risk investment, and you should not expect to be protected if something goes wrong.